IEA (2019), World Energy Investment 2019, IEA, Paris https://www.iea.org/reports/world-energy-investment-2019, Licence: CC BY 4.0
RD&D and new technologies
Investment in energy RD&D
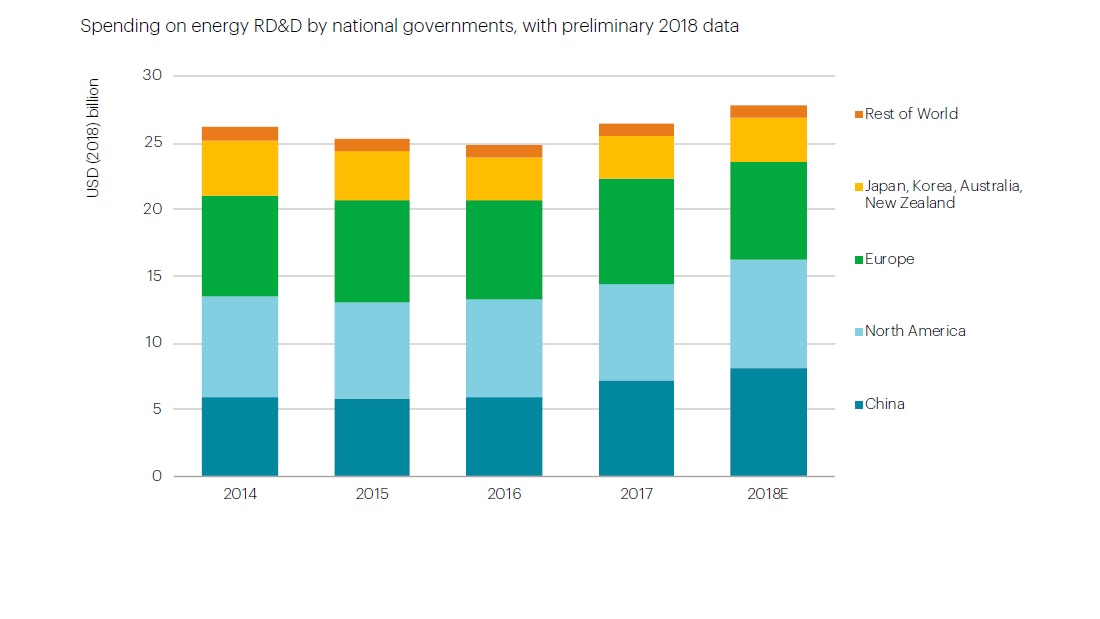
Government energy RD&D spending grew 5% in 2018, led by China and the United States
Note: RD&D = research, development and demonstration, as defined by the IEA Guide to Reporting Energy RD&D Budget/Expenditure Statistics, 2011.
This trend reflects recent pledges and commitments by governments
Preliminary information indicates that governments around the world spent around USD 26 billion (United States dollars) on energy RD&D in 2018, suggesting a 5% increase year-on-year, similar to the previous year’s increase.
While indications are preliminary, it appears that spending on the subset of clean energy technologies, which Mission Innovation member countries pledged in 2015 to double over five years, is growing more strongly than total energy RD&D spending.
China’s energy research and development (R&D) budget grew most in absolute terms in 2018, with spending on renewables and higher-performing fossil fuel technologies increasing the most. The US budget for energy RD&D increased by more than 12% in 2018, with notable rises for solar energy, hydrogen, and alternative vehicle technologies. The budget already passed for 2019 continues the upward trend but with lower growth rates in most areas.
The EU research budget is approved for multi-year cycles and annual variations in spending should be seen in this context. The commitment to energy research remains high, but actual funding for energy research in 2018 fell back by around 15%. While R&D spending for cross-cutting technologies (such as smart grids) rose, it was lower in other areas, notably for energy efficiency and nuclear. Still, as the EU research budget is approved for multi-year cycles, annual variations do not change the overall growth in spending in each funding period.
The five leading countries for public spending on energy R&D were the United States, China, Japan, France and Germany. These five countries accounted for around 70% of all such spending worldwide. RD&D budgets in Denmark and Italy also increased in 2018, while in Germany spending declined 2%.
While energy R&D spending by car companies jumped, oil and gas company R&D has yet to bounce back significantly since 2015
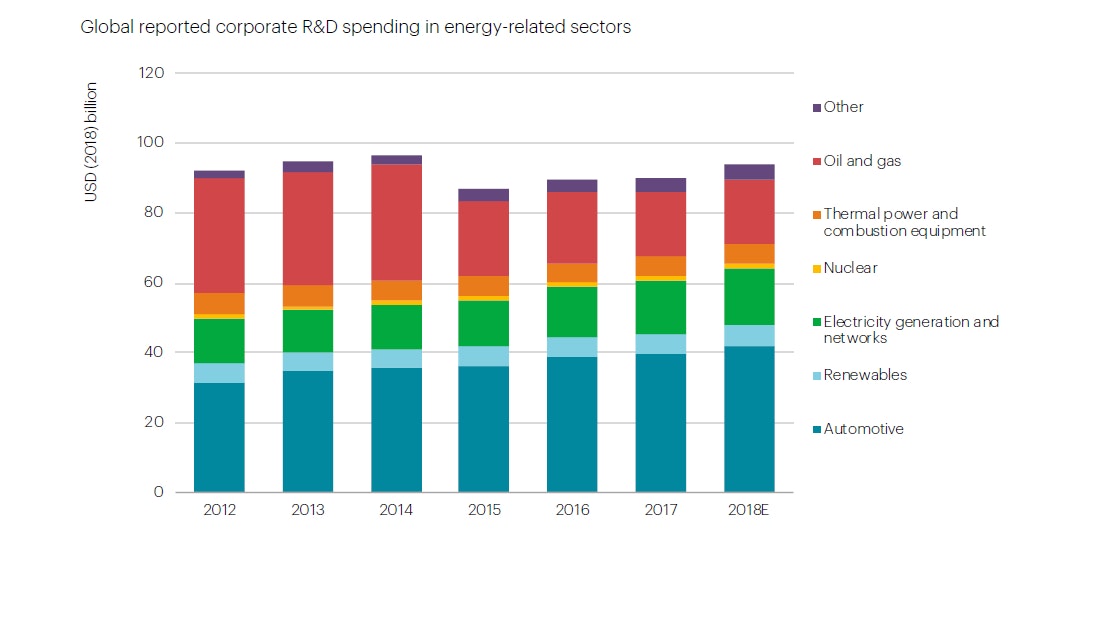
Note: Classifications are based on the Bloomberg Industry Classification System. All publicly reported R&D spending is included, though companies domiciled in countries that do not require disclosure of R&D spending are under-represented. To allocate R&D spending for companies active in multiple sectors, interviews with company decision-makers and, in the absence of other data sources, the shares of revenue per sector were used. “Other” comprises CCUS, electricity storage, insulation, lighting, other fossil fuels and smart energy systems.. Depending on the jurisdiction and company, publicly reported corporate R&D spending can include a wide range of capitalised and non-capitalised costs, from basic research to product development and, in some cases, resource exploration. It is not unusual for the development of like-for-like substitution products and problem-solving for well-established technologies to dwarf research into new technology areas.
R&D budgets also increased for companies active in energy storage, energy efficiency, nuclear and combustion technologies
The sample of listed companies active in energy technology sectors for which 2018 data is currently available increased their annual energy R&D spending, by around 4% (including automakers). The total energy R&D spending of this sample reached nearly USD 94 billion in 2018. Excluding transport, two-thirds of the total corporate energy R&D was in low-carbon sectors.
Automakers – who typically have much higher R&D budgets than energy companies in absolute terms and as a share of revenue – continue to increase their R&D spending as government policies and competitive pressures drive higher spending on energy efficiency and electric vehicles. Automakers were the biggest contributors to the growth in corporate energy R&D spending technologies in 2018.
This trend is notable among major European and US car and auto parts companies, whose R&D spending rose by around 7% on average in 2018, compared to 4% for Japanese and Korean firms. However, the increasingly global presence of Chinese automakers is reflected in their R&D spending, which rose more than 20% on average.
Corporate R&D spending by companies in the oil and gas and other fossil fuel extraction sectors showed 1% growth in real terms in 2018, the first increase in R&D spending in this sector since 2014. Spending remains 45% below 2014 levels, however, and is not rising significantly as a share of revenue.
While the rebound of oil and gas company R&D budgets is sluggish, that of electricity generation and supply companies continues to rise. Siemens and General Electric occupied the top spots in the list of the highest global energy R&D spenders, with Petrochina dropping out of the top three for the first time in a decade. Four of the top ten are Chinese companies, and five are in the electricity sector.
Trends in investment for early-stage technologies
A record year for venture capital investment in clean energy
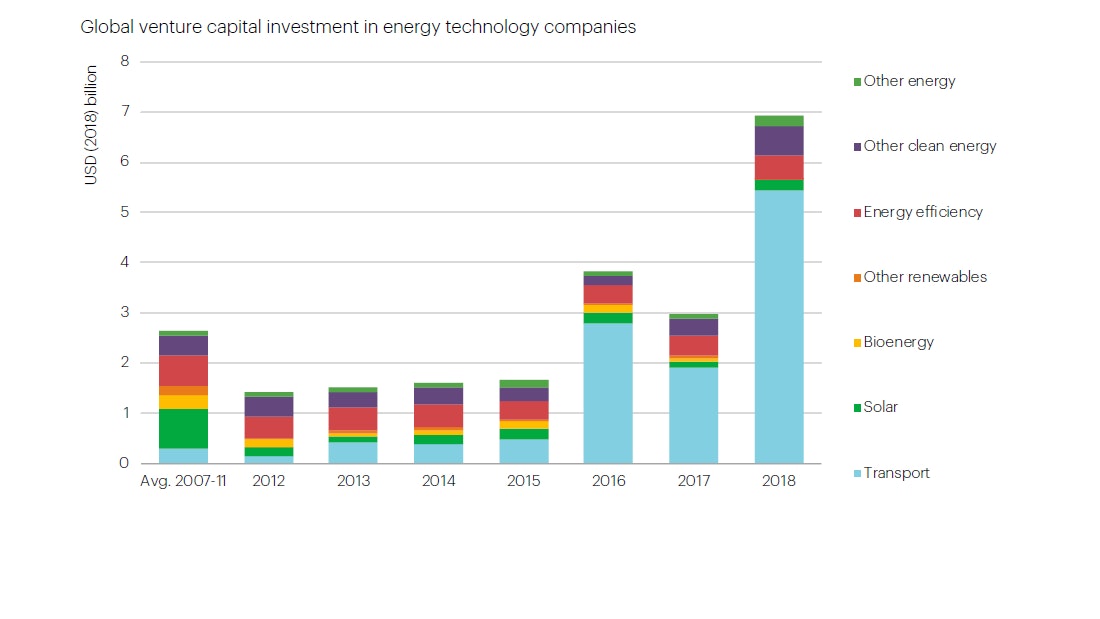
Note: Includes Seed, Series A, and Series B financing deals. Transport includes alternative powertrains and fuel economy but does not include shared mobility, logistics or autonomous vehicle technology. Bioenergy does not include biochemicals. Other energy includes fossil fuel extraction and use. Source: Cleantech Group (2019), i3 database.
Venture capital action is in clean mobility, while renewables deals shrank
Venture capital (VC) investment in emerging energy companies (seed, series A and B) reached an estimated USD 6.9 billion. While these sums are much lower than those invested in RD&D projects, this is a notable high- point for VC deals in energy, which are mostly focused on clean energy technologies.
While solar energy made up a significant share of transactions before the 2012 cleantech bust, recent growth has been driven almost entirely by clean transportation investment. Most of the transport deals are in EV technology and services.
Despite the large increase in deal value, the total number of early-stage VC deals in 2018 was broadly similar to 2017. This indicates a major increase in deal value, driven notably by deals larger than USD 0.5 billion, such as those for electric car firms Evelozcity, Youxia Motors, Xiaopeng Motors, and Byton.
The share of China-based start-ups in total VC value for early-stage energy technologies overtook the traditionally dominant United States, with Chinese companies receiving over half of the deal value.
However, excluding large deals (over USD 50 million) raises the US share to over 50%. Only 30 of the 400 deals (7%) were for companies in China, compared to 52% in North America and 30% in Europe.
Outside transport, the biggest increases in VC activity by technology areas were for energy storage, hydrogen, and fuel cells, as well as technologies for fossil fuel extraction and conversion. Investment in Zenobe Energy (a battery storage operator), Malta (a developer of thermal storage), Kayros (an energy data and tracking firm), and Solid Power (a solid-state battery company) were the biggest deals in these sectors 2018.
More companies investing in energy start-ups are from outside the sector

Note: ICT = information and communication technology. Deals types include grant, seed, series A, series B, growth equity, private investment in public equity (PIPE), coin/token offering, buyout, and late-stage private equity. Unless otherwise stated, deal value is shared equally between multiple investors in a single deal. Energy technology companies are defined as per the previous chart. Source: Cleantech Group (2019), i3 database and IEA analysis.
Investments by battery companies were big deals in 2018
Corporate investments in energy technology start-ups, including corporate venture capital, totalled around USD 0.9 billion in 2018. While 2018 did not see such high deal value as 2017, it remained high by the standards of the “cleantech boom” in the period to 2012. This indicates that large companies see a strategic case for direct investment in innovative, nimble technology players.
Clean transport companies received the most money from corporate investors, with Xiaopeng Motors raising nearly USD 1 billion in total in 2018 and CityScoot raising USD 50 million.
Investments by companies from the traditional energy sectors declined by 7% in 2018. Those by oil and gas companies and equipment manufacturers offset a much larger decline in investments by utilities.
Notable deals were Chevron’s investment in ChargePoint (alongside AEP and Siemens); Equinor’s in EtaGen gas generators with AEP and Centrica; and E.ON’s in tado home energy management.
The role of information and communication technology and automotive companies in energy technology start- ups was less evident in 2018 as their deal value shrank back to near-2016 levels.
However, non-traditional players, notably battery manufacturers, invested more than traditional energy actors. CATL, a Chinese battery company, and FAW, a car company, were involved in an investment in Byton, an electric car company. CATL also invested in Sila battery materials, alongside Siemens.
Overall, companies inside and outside the energy sector are increasingly using corporate venture capital investments as part of a flexible and more open energy innovation strategy.
Signs of interest in CCUS & hydrogen, as battery factories bloom
China’s first large-scale carbon capture, use and storage (CCUS) project, for enhanced oil recovery at CNPC’s Jilin Oil Field, was commissioned in 2018. There was also a significant jump in announcements of new CCUS projects that could enter operation over the next decade. For the first time since 2010, the number of CCUS facilities that are operating, under construction or in planning around the world rose, reaching 43.
In 2018, the United States expanded and enhanced the “45Q” tax credit for CCUS with up to USD 50 per tonne of CO2 permanently stored and USD 35 per tonne of CO2 used in enhanced oil recovery.
Plans for six new CCUS projects were announced in 2018 in Ireland, the Netherlands and the United Kingdom. The focus of new European CCUS projects has shifted towards capturing CO2 from hydrogen production, with at least four of these six projects planning to inject low-carbon hydrogen in natural gas networks by 2030.
In 2018, strong recent momentum behind hydrogen projects was maintained, with over 20 MW of electrolysers coming online for energy and climate applications, plus many project announcements for electrolyser projects up to 100 MW in scale, mostly in Europe. Overall, the value of the electrolysers installed in the last two years is around USD 20 to 30 million per year. However, the level of investment is insufficient for a sustainable and self-financing hydrogen sector for the longer term.
Expansions of battery manufacturing capacity for electric vehicles announced in 2018 are expected to translate into major investments ahead. Large producers shared plans for USD 20-30 billion of spending on over 400 GWh of capacity by the mid-2020s. Production in 2018 was around 70 GWh.