Cite report
IEA (2022), Implementing a Long-Term Energy Policy Planning Process for Azerbaijan: A Roadmap, IEA, Paris https://www.iea.org/reports/implementing-a-long-term-energy-policy-planning-process-for-azerbaijan-a-roadmap, Licence: CC BY 4.0
Report options
Key elements of energy policy planning
Collaboration with statistics agencies
Energy is central to nearly all aspects of everyday life and business activity. Therefore, developing a long-term energy plan is most successfully achieved in a collaborative way that involves all government ministries, as well as outreach to the public and businesses. Producers of energy statistics are a key element in this process.
There are two key aspects of this collaboration: first, statisticians will provide the essential information needed to understand the current energy situation. These data need to be used effectively in the policy planning process and in the ensuing modelling work. Thus, it is vital that the statisticians are effectively integrated in policy planning and later in the policy monitoring processes that are ultimately established.
However, there also needs to be collaboration within the statistics community. In general, government statistics are organised in two ways: centralised or decentralised. For centralised information, the National Statistics Institute (NSI) is responsible for collecting and disseminating information to users, including ministries. Decentralised statistics will see ministries collecting and compiling data themselves, although ideally in co‑ordination with the NSI. There are pros and cons to both approaches. A more centralised approach allows for greater resilience and the sharing of knowledge across a wider statistics workforce. A decentralised approach brings policy colleagues closer to the data, but it can also mean that statisticians in ministries may be less aware of wider statistics developments or less able to maximise the benefits of wider statistical surveys.
A large statistical institute will still need a strong push to communicate across all topic areas, and will still need to reach out to the respective topic policy makers to ensure the statistics accurately reflect the situation in the country. Where a system is less centralised, statisticians will need to communicate and co‑operate across ministries to achieve a cost-effective approach to working, sharing ideas and informing colleagues of policy changes.
Fundamentally, structure is less important than achieving good co‑operation among statisticians, and effectively working together and enhancing links with policy colleagues (something that should be pushed from both sides). An advisory group involving all the relevant stakeholders has proven to be an effective channel for the countries to co‑ordinate activities around energy statistics.
A further beneficial condition for ensuring comprehensive energy statistics is the degree to which they are produced independently. There are several ways of achieving this, either via a Statistics Act or via codes that govern the way statistics are produced and disseminated. To whom the NSI reports in a government structure can also be important, especially in a centralised approach. In general, the closer the NSI is to the heart of government, such as a president or prime minister, the more likely it is that statistics are developed to meet the needs of a whole country across all topics – especially if independently governed.
Policy making
At its core, policy planning is a cycle:
- identify the initial need for a policy
- begin the design process
- implement the policy
- monitor and evaluate how well the policy is working
- redesign if necessary.
However, in the real world, policy planning and implementation are rarely as straightforward. Different stages of this process may need to be repeated or revised, depending on the actual outcomes of the policy.
Deciding what policies are actually needed is often a complex process. Initially there should be an overall strategy emanating from observed needs and providing a view on the main goals a country needs or wants to achieve. These goals are likely to come from the top of government, and may often be quite high-level, such as improving energy security, boosting the economy or achieving environmental targets.
The next step is to understand what these high-level goals mean in practical terms. Enhancing security could mean many things, including embarking on a programme of energy efficiency (to reduce demand), diversification of electricity supply, changing the way fuels are used in homes and business, and enhancing energy interconnections, among many others.
At this point, strategic goals need to be transformed into actual policies. The government must assess the current situation, the reasons for lack of action or change, possible solutions, and what policy or intervention can make an impact to achieve those goals. Only then can work begin on actual policy design, and one of the key inputs of policy design is energy modelling, which in turn relies on high-quality energy statistics.
In order to be able to properly assess and evaluate these strategic goals and move into the policy-making process, the government must call on a variety of skill sets and expertise. Policy making needs input from all analytical professions (statisticians, economists, operational and social researchers), engineers, technical energy specialists and policy advisers.
The role of statistics and statisticians in the policy cycle
One essential part of statisticians’ responsibilities is to measure and assess what happens as a result of the policy, via a monitoring process. However, statisticians and statistics should be involved across the entire process for if they play only this one role, then the policy design will be less comprehensive with less optimal outcomes.
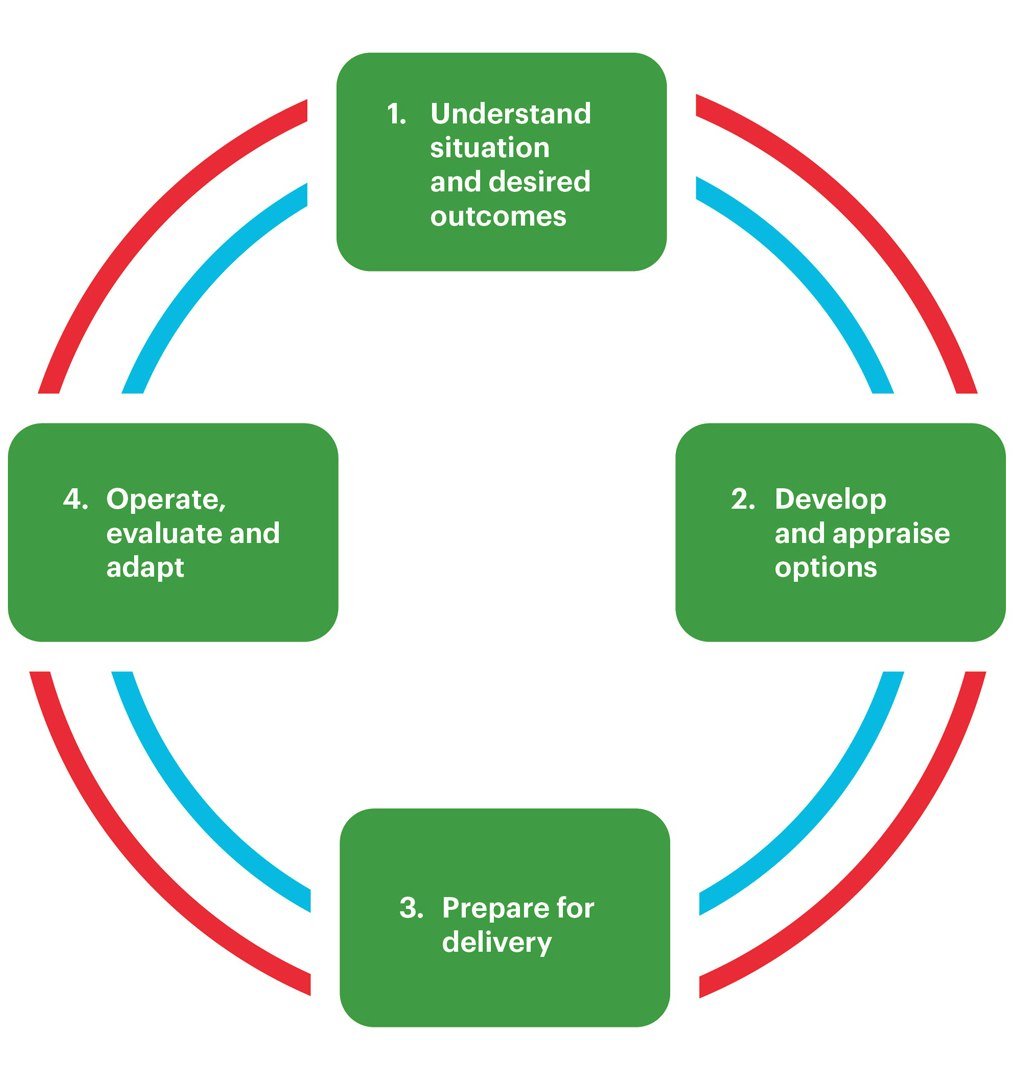
The Policy Delivery Cycle
Open
The policy delivery cycle, as shown in the figure above, has a role for statistics and statisticians in all stages. Starting from the initial understanding of the situation, statistics are vital to show what is actually happening, and to explain why there may be unknowns, via missing data. This will help policy makers understand how the impact of a policy could be measured. In this first stage, as well as in the second stage when policy makers develop and appraise options, it is helpful and often necessary to review what other countries have done. Energy data are also a boon here, as they allow both statisticians and policy makers to understand the impact of similar policies.
It is always important to start with a defined benchmark, or the base data year from which change can be measured. These data may already be collected in energy statistics, but it may be necessary to produce a new data series. That work needs to start very early in the policy cycle, and to be complete by the time policy makers are in stage three, preparing for delivery. During this phase statisticians should be finalising the means of collecting the data to monitor the policy. This is likely to involve discussions with policy advisers as well as implementing agents, in order to have the correct data recorded that will make up the key administrative information captured as part of the policy. Should a policy be piloted, then statisticians should be involved in assessing the results of the pilot. Finally, as the policy is launched, then statisticians should continue to play a key role, ensuring the effective monitoring of the policy so that its impact can be properly understood.
The policy delivery cycle – where the use of statistics can really make an impact
The policy delivery cycle benchmarks
Open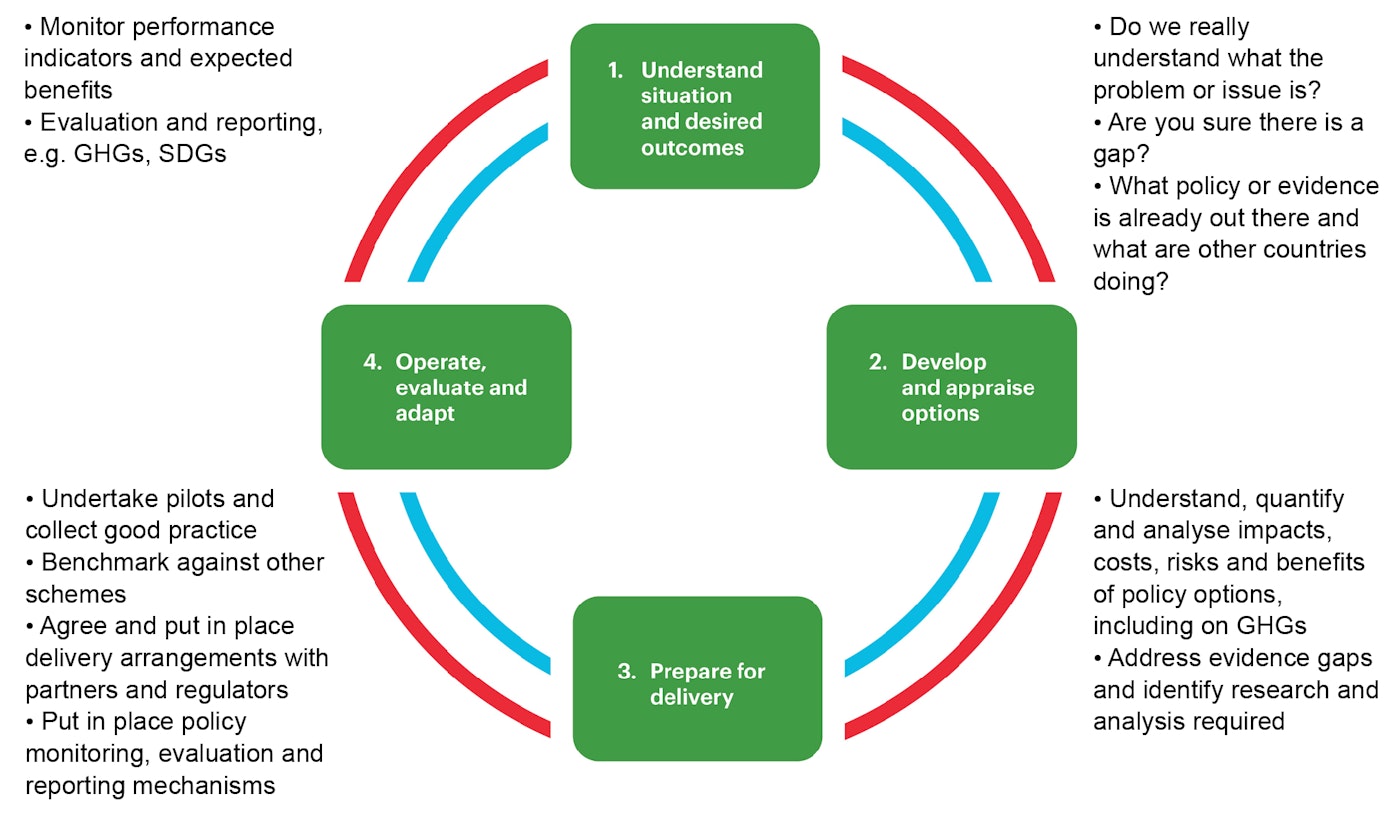
Data needs for key energy policy areas
Each country has its own energy policy priorities. However, as countries grapple with the effects of global warming, many are working to transition their energy systems towards increased sustainability. As a result, tracking energy transitions has become a priority for many governments as they work to both set and meet targets. When tracking clean energy transitions, several policy areas can be identified:
- Sustainable Development Goals (SDG 7)
- energy efficiency policies
- sectoral policies (industry, transport, buildings, power sector – clean power)
- renewable energy policies
- security of electricity supply
- fuel switching in the electricity mix
- strong links between energy and climate policies
- energy is the main contributor for the GHG emissions
- many NDCs are related to energy.
The policy areas above use both single indicators (e.g. SDGs) and large datasets (e.g. energy balance, GHG inventory) to support government analysis and the resulting policy choices. The data allow policy makers to define the status quo and track the progress of selected policy measures. The majority of the necessary energy information is derived from the same basic energy data collection, therefore any investment in data directly benefits the policies as well.
The data needs can be narrowed down to three categories:
Data on energy supply
- production, trade and stocks of energy
- energy infrastructure (e.g. production capacities).
Data on energy demand
- energy transformation (electricity and heat, oil refining)
- consumption by sector (industry, transport, residential, services, agriculture, etc.)
- should also cover non‑commercial energy consumption (e.g. fuelwood)
- end-use energy consumption (e.g. residential space heating, light road transport consumption).
Economic activity data (essential for energy efficiency)
- output of economic sectors
- characteristics e.g. the building and transport stock in a country.
It is evident that there are overlaps in policy areas. To avoid optimising the energy system only on a “local” level, a holistic view of the energy system and all the potential pathways is necessary. Given the complexity of a modern system, it is not feasible to conduct such analysis manually. Modelling allows policy makers, analysts and statisticians to use data for scenario analysis to assess the impact of different alternatives. This will in turn be used to inform and drive policies and targets.
Modelling, however, should not just be seen as a mechanical input-output exercise. Several steps are necessary both before and after the actual modelling work in order to mimimize uncertainty and maximise the usefulness of the results:
- Energy data production – must be adequate to support the data-heavy models.
- Energy data validation and analysis – allows users to assess uncertainties in the model inputs.
- Scenario formulation – translates the research question into targets. It is also essential to properly assess economic drivers and take into account the potential impact of energy efficiency.
- Validating assumptions and compiling model inputs – while some assumptions are always necessary, understanding their impact to the results is important.
- Running the model itself – requires skilled capacity that can only be developed over time for the activity to be sustainable.
- Interpreting the results – assessing the results requires information from all the previous steps.
- Formulating policies based on the results.
Models
Energy modelling remains an important part of the policy development process. There are virtually as many energy models out there as there are policy questions to understand. The choice of which model to use is driven by the needs of users and depends on the questions to be answered. Often a single model is not enough to address all relevant aspects of a question or scenario.
Models can be used to provide projections and explore scenarios. They can answer questions such as what will happen in 2050 with today’s existing policies. They can also explore normative scenarios such as how to reach a single (or a set of) policy target(s), or explorative scenarios such as understanding the impact of specific policy measures or strategies on the energy sector. Often these are compared against a baseline or business-as-usual scenario. Some models can be very complex and only usable by trained users, but some are designed to be used by a wider population, in order to open up debate in government, media, academia and the investor community. These models do often require a lot of work outside of the model itself. Energy models can be top-down or bottom-up. They can aim to model everything in the energy system and find cost-based solutions or they can be used to explore more speculative scenarios.
In some cases models can be used to estimate missing data on a more granular level than provided in energy balances, or check the plausibility or consistency of data from different sources. In general, though, direct collection of such data is preferable.
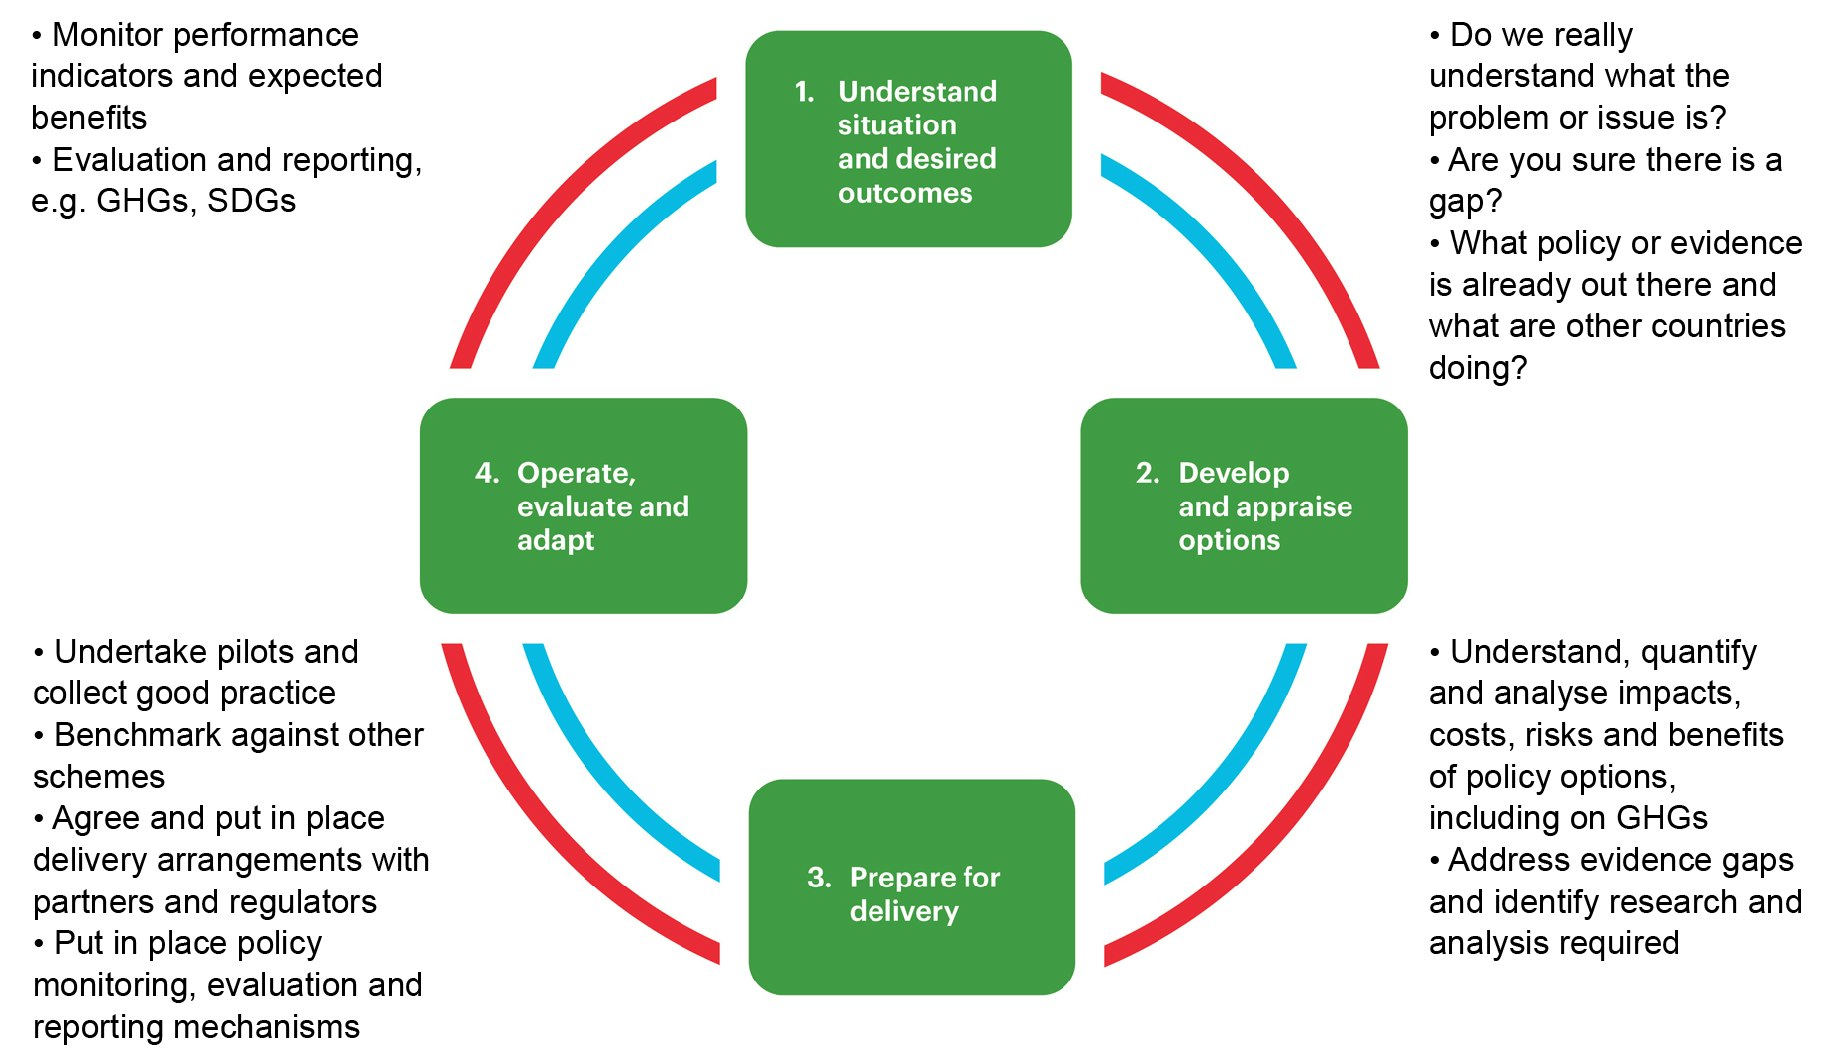
As a generalisation, models in wide use can be thought of as being one of four types: general equilibrium (GE) type models; MARKAL/TIMES; LEAP and 2050-type calculators. The figure below highlights some of the differences between these models based on three factors.
For a more detailed description of model types, please see the annex.
Energy Model Types And Differences
Open
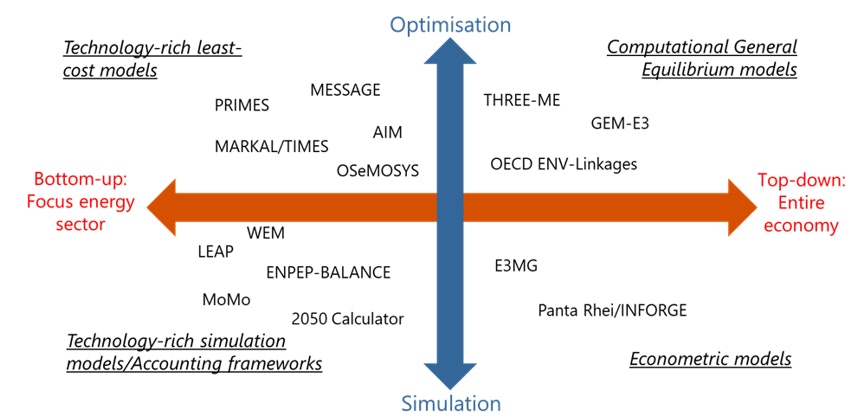
Models can also be distinguished along the dimensions of simulation versus optimisation and energy sector versus economy-wide models, designed around the questions that different fundamental modelling approaches can address.
Energy Models and Uses
Open
GE type models cover the entire economy, while energy system models such as LEAP and TIMES cover only the energy sector (for that reason, the latter are also referred to as “partial equilibrium models”). While the energy sector is not represented in a technologically detailed fashion as in energy system models, GE models help to analyse the interactions of the energy sector with the rest of the economy, e.g. the impact of energy policies on GDP, employment or trade balances.
Some models are used widely around the world, for example LEAP and calculator type models, given that these are available for free in developing countries. However, the software costs alone do not reflect the full costs of energy modelling – the most expensive aspect is the staff needed to do the modelling. Staff fluctuation, particularly in government ministries, has often hampered the development of long-term in-house modelling capacity in developing countries.
What is key to remember is that no one model type is better than another. Finding the right model is driven by the needs of the country. And since not all models can do all things, combinations of models can be very beneficial. For example, a country may want to use a 2050-type calculator to have a wider debate about possible policy choices, but then may need to make use of a MARKAL/TIMES model to properly understand the costs of the chosen route. An approach like this may well be a good route for Azerbaijan.
Data needs for models
As a general rule, the more data that are available the better the model. However, the accuracy of the data and an understanding of their uncertainty may be even more important. A model cannot improve the quality of poor data, so a well-designed model being fed with poor or incomplete data will not produce useful results. Data for models, a large amount of which will be drawn from official energy statistics, also have uncertainty. When using less precise data in a model, it is sensible to do sensitivity analysis, using ranges for the variable you are modelling.
At the heart of all energy models will be comprehensive supply and demand energy data. In general supply-side data are taken from an energy balance and the supporting commodity balances. Thus, a prerequisite for a model is a good energy balance, built in accordance with the International Recommendations for Energy Statistics, as endorsed by the UN Statistical Committee (UN, 2018).
An energy balance provides only extremely high-level data on the demand and use of energy, and as demand drives supply, all models need comprehensive demand data covering all four main sector groups (transport, industry, household and commercial), but in quite a detailed way. This will nearly always mean that some form of consumption survey will be needed for the household, industrial and commercial sectors. For transport, a large amount of data might be available from administrative sources, but the real challenge is often accessing private-sector data. In this case it can be useful to work with the expenditure survey (that is likely to be run in a country) to see if questions can be added there. However, the ideal is to run a household transport survey.
In most cases it is very valuable to have current as well as historical data, in order to help establish trends. In addition, it is very important to choose the right year as a base year. Ideally it should be the most recent year for which data are widely available.
It is highly unlikely that all of the data needed will be available in-country, so they will probably need to be supplemented by available data from international sources, or by utilising data from neighbouring countries with similar energy infrastructures. Finally, it is inevitable that some estimates will need to be made.
Nearly all models have options attached to them, and as such they can usually be run in a simplified or more advanced way, for example adding costs, GHG emissions, air quality, etc.