Cite report
IEA (2021), Gas Market Report, Q1-2021, IEA, Paris https://www.iea.org/reports/gas-market-report-q1-2021, Licence: CC BY 4.0
Report options
2020 highlights
Gas demand for power generation was resilient thanks to fuel switching
Natural gas use in power generation fell an estimated 2% y-o-y worldwide in 2020. This is in line with total electricity demand and despite that output from renewables was up 6.6%. Cheap and abundant supply favoured gas in the merit order at the expense of coal in several markets.
Abundant US production supported an increase in gas-fired power generation in North America. In the United States, gas-fired generation increased 3% in 2020 while overall electricity output was down 2% and coal’s share plummeted by 19%. In late July, gas reached a record share of 45% of electricity generation in the United States. In Mexico, total electricity output was lower than in 2019 for the first three-quarters of 2020, but gas-fired generation increased slightly at the expense of liquid fuels and coal.
In Europe, gas-fired power generation rose through the second-half of 2020. Following a steep decline of more than 10% in the first-half, gas-fired power generation rose by over 4% y-o-y in the third-quarter (Q3), despite a 4% fall in electricity consumption.This was partly driven by lower nuclear availability due to plant retirements, maintenance work, unexpected outages amid low river levels (for cooling purposes) and optimisation of fuel usage. Gas benefited from the combination of low prices and a sharp recovery in carbon prices through Q3 2020, while coal-fired generation fell by more than 8% in Q3. Despite the recovery in gas prices to above 2019 levels, gas-fired power generation rose 2.5% y-o-y in Q4, while power output from coal- and lignite-fired plants fell by close to 7%. This was primarily driven by Turkey, where gas-fired power generation increased 50% due to depressed hydro availability and environmental restrictions on lignite-fired plants.
Fuel switching trends are more mixed in other regions. In Asia, the People’s Republic of China (hereafter “China”) saw a 2% y-o-y increase in gas-fired generation for the first eleven months of 2020, while electricity demand was up 2% and coal declined slightly. Gas-fired generation in India increased 9% in 2020 thanks to cheap LNG spot prices, while coal declined 5%. Falling oil-linked LNG prices provided tougher competition for coal in Japan's power sector. Coal-to-gas switching continued throughout the year in Korea, with record gas burn in September.
In the Russian Federation (hereafter “Russia”), thermal power generation fell 10% y-o-y in the January-October period, squeezed by a 3.7% drop in electricity demand and a 12% increase in hydropower output. Coal-fired power generation fell more than 13%, while gas-fired power generation decreased approximately 10%.
Thermal generation also fell in South America on favourable hydro conditions combined with lower electricity demand. Gas-fired generation dropped 11% y-o-y in Brazil and 6% in Argentina over the first eight months of 2020.
In the Middle East, the squeeze on associated gas availability resulting from oil production cuts coincided with peak electricity demand in the northern hemisphere summer. This led to a resurgence of oil use in power generation in some key oil and gas-producing countries.
Limited prospects for increased gas-fired power generation in 2021, but policy measures provide longer term support in emerging Asian markets
Prospects for increased use of gas in power generation may be limited in 2021 in some regions, patricularly in mature markets. This reflects the expanding contribution of renewables to the power mix. As well, fuel price projections suggest less competitiveness for natural gas and consequently a potential rebound of coal in electricity generation in the United States.
Prospects for more use of gas in power generation are favourable in Asia. They are fuelled by policies that support gas and LNG in power programmes and that limit development of coal-fired generation, principally in South Asian and Southeast Asian economies. Recent announcements are noted in Bangladesh, Viet Nam, Thailand, Myanmar and the Philippines.
Gas-fired generation in the United States rose as total electricity demand fell and coal-fired generation plummeted in 2020
Gas value chain demonstrated strong supply flexibility
Long-distance and inter-regional gas pipeline trade bore the brunt of the supply adjustment in the face of lower demand with an estimated 15% (40 bcm) y-o-y contraction in trade flows. A steep fall in pipeline exports moderated as from June, supported by increased demand and lower LNG inflow. North African flows rose 8% through the second-half of 2020, while Russian flows returned to 2019 levels in Q4.
Pipeline imports to Europe decreased by 13% (30 bcm), primarily due to lower inflows from Russia and North Africa. This compares with a decline of 13% (28 bcm) in 2009, when European gas demand was depressed by the financial crisis. Pipeline flows fell 22% y-o-y in the first five months of 2020, at a time when flexible LNG was increasingly diverted to Europe amid subdued demand in Asia. This highlights the crucial balancing role of Europe in the global gas market.
In Asia, China decreased its import flows from Central Asia by 14% (6 bcm) y-o-y in the first eleven months of 2020, with Turkmenistan accounting for three-quarters of the reduction.This supported China’s strategy to increase spot LNG purchases and accommodate the gradual ramp up of the Power of Siberia pipeline (reaching 4.1 bcm in 2020).
Global LNG supply proved its flexibility in the face of market oversupply, which hit its peak during the summer months of 2020. Global LNG exports fell by 22% between January and June 2020 – much steeper than the 5-7% seasonal swing normally observed during this period. The United States, which emerged as the world’s largest swing supplier of LNG in 2020, accounted for a third of the downward adjustment in global LNG exports. A wide range of other producers – including Malaysia, Oman, Trinidad, Egypt and Indonesia – also responded to the pandemic-induced drop in demand with supply curtailments. The second-half of 2020 saw a sharp recovery as LNG export volumes gained momentum in Q4. Between June and December, global LNG supply increased by 25%. US LNG output fully recovered and ran at record levels by the end of 2020, but the rest of the world – led by Russia, Australia, Malaysia, Egypt and Oman – also posted strong gains, together accounting for half of the net increase in LNG exports over the June to December period.
LNG tanker fleet helped balance a heavily oversupplied market
LNG floating storage volumes remained at elevated levels during the first three-quarters of 2020, and, at times, absorbed more than 10% of monthly LNG trade in Q2. In Q4, LNG floating storage levels were relatively subdued and below the average of the previous year. The shift reflects the simultaneous tightening of global gas and LNG shipping markets from September. As demand picked up in Asia, regional price spreads widened and long-distance trade expanded quickly. US cargo cancellations, which previously kept the LNG shipping market relatively loose, all but disappeared by the end of 2020. Daily spot LNG charter rates rose above the USD 100 000 mark by the end of October and approached USD 200 000 as the year drew to a close. The monthly cost of floating LNG storage increased more than fivefold between June and December 2020 from less than USD 0.3/MBtu to more than USD 1.3/MBtu. The steep tightening of inter-month price spreads diminished the economic incentive to keep LNG on the water for longer than necessary during much of Q4.
Supply flexibility at play during the Covid-19 crisis
Inter-regional natural gas trade, 2020 relative to 2019
OpenAn increasingly liquid global gas market is emerging…
The global gas market continued to gain in depth and liquidity in 2020 despite shrinking demand. This reflects expanding volumes of LNG traded on the spot market and a substantial rise in volumes traded on regional gas hubs.
LNG volumes traded on spot and short-term basis continued to rise in 2020. Preliminary shipping data suggest an increase close to 8% to account for 37% of global LNG trade – its highest share on record. Short-term volumes were driven up by higher net selling positions of portfolio players and uncontracted commission cargoes. In contrast, the share of volumes traded under long-term contracts has been declining and was further depressed due to cargo cancellations through the third-quarter.
The United States continued to be the largest source of flexible LNG, with a 20% share of spot and short-term volumes, which account for over half of incremental supply of spot and short-term LNG. This is largely driven by the ramp up of new liquefaction facilities, including Cameron Train 2 and 3, and Elba Island.
China and India remained the world’s largest buyers of short-term and spot LNG, with respective market shares of 20% and 11%. Buyers in China were particularly keen to benefit from the low spot prices through 2020 and increased purchases more than 50% y-o-y under short-term contracts and spot LNG, which offset more expensive sources of supply, including piped imports from Central Asia. China alone accounted for 40% of gross growth in spot and short-term LNG trading.
In Europe, Turkey increased purchases of short-term and spot LNG more than 50%, largely at the expense of piped imports from Iran and Russia, especially during the first-half of 2020.
Traded volumes on all major regional gas hubs increased. This highlights the increased appetite of market players to hedge positions along the forward curve.
In the United States, volumes traded on the Henry Hub in 2020 rose by more than 15% y-o-y.
In Europe, gas traded on the region’s major hubs expanded 13% y-o-y in the first eleven months of 2020, largely driven by the 19% volume increase on the TTF hub in the Netherlands. TTF’s share in total European gas trade rose from 66% to over 70%, further cementing its position as Europe’s leading gas hub. Yet, volumes traded on the TTF are more than ten-fold lower than the US Henry Hub volumes traded on the NYMEX. Another important development in Europe has been the increasing share of volume traded on exchanges, from one-third in 2019 to 38% in 2020, which typically offer more standardised products, rather than via brokerages.
In Asia, trading in ICE JKM derivatives continued to increase in 2020, jumping almost 60% y-o-y.This shows growing interest from market participants to diversify price risk management strategies along the continued trend of LNG commoditisation.
Marketing strategies of traditional players may evolve towards increased focus on the short-term, amid the expanding liquidity of global and regional gas markets. Gazprom sales via auctions (for intra-annual deliveries) increased by 30% in 2020 compared to 2019, representing more than 10% of its exports to Europe. In November 2020, Qatar Petroleum announced the establishment of its trading arm, QP Trading, with a mandate to build a globally diversified portfolio and manage price risk exposure via physical and derivatives trading.
Carbon-neutral LNG continued to gain traction, with at least seven carbon-offset cargoes delivered in 2020. Singapore’s Pavilion held the world’s first LNG tender that included a bidder’s obligation to quantify greenhouse gas emissions associated with each LNG cargo.The tender was won by QP Trading, which signed a ten-year production sharing agreement in November 2020.
… with LNG traded on spot and short-term basis reaching new highs
Gas price roller coaster: historical lows, steep recovery and high volatility…
It was a roller coaster ride for regional gas benchmark prices in 2020. Prices collapsed in all major gas consuming regions in the face of sharp drops in demand. By late May, day-ahead prices on the TTF hub fell below USD 1/MBtu and LNG spot prices in Asia dropped below USD 2/MBtu, both historic lows. In the United States, trades on the Henry Hub averaged USD 1.8/MBtu over the first-half of 2020 – the lowest price for this period since 1995.
Conversely, gas benchmarks recorded strong gains through the third-quarter. Prices rose to above 2019 levels by the start of the heating season. Increases in demand and supply adjustments along the gas value chain drove the recovery. TTF prices almost quadrupled through Q3 and traded almost 25% higher y-o-y in Q4. LNG spot prices in Asia followed a similar price trajectory, climbing above last year’s levels in Q4. Despite the recovery, the annual average of TTF (USD 3.2/MBtu) and Asian (USD 4.2/MBtu) spot prices were historic lows. Price gains at Henry Hub were largely driven by rising LNG exports and lower production through the last quarter 2020, allowing the North American benchmark to return to 2019 price levels. Henry Hub prices averaged USD 2/MBtu in 2020, the lowest price level since 1995.
Large price swings had wide seasonal spreads and high volatility reflecting unprecedented market uncertainty that prevailed through the year. Month-ahead volatility on both Henry Hub and TTF averaged 65% – the second-highest level for both since 2008.
Oil-indexed LNG prices recorded heavy losses through the second-half of 2020, unlike the spot indices. The oil-premium (i.e. the estimated difference between oil-indexed and spot prices) started to gradually disappear after reaching a high of USD 7/MBtu in May and effectively turned negative by October – for the first time since September 2018. Oil-indexed LNG pricing dominates in the Asia Pacific market, where the average LNG import price in China, Japan and Korea fell by close to 40% y-o-y between September and November to an average of USD 5.6/MBtu, despite strong gains in spot prices.
Rising volumes of LNG supplies that are destination flexible increase liquidity of the global gas market and are underpinned by increased affiliation with regional gas hubs. This means that gas prices in a given market are becoming increasingly sensitive (and responsive) to the supply-demand fundamentals prevailing in regions beyond their immediate geographical reach.
The correlation between TTF and Asian LNG spot prices increased from 0.86 in 2019 to close to 0.95 in 2020 – the highest annual level on record.The correlation was particularly strong through the second-half of 2020 driven by improving market conditions both in Asia and Europe, and more active competition for LNG cargoes. Most importantly, the correlation between Henry Hub and TTF, and Henry Hub and Asian spot prices continued to increase to reach 0.81 and 0.76 respectively from relatively low levels just two years ago. The rapid ramp up of US LNG exports – rising more than threefold since 2017 – underscores the increasing linkages between Henry Hub and other regional indices.
In contrast, the correlation between oil and natural gas prices stayed well below the 0.6-0.7 annual averages experienced between 2012 and 2016, when oil prices had a stronger influence on Asian and European spot prices.
The high correlation between regional natural gas prices in 2020 could be diminished by tightening of the global gas market or unexpected regional supply-demand shocks. However, the mechanisms underpinning the rising liquidity of global gas trade – flexible LNG volumes and marketing strategies evolving toward optionality – are likely to be sustained and continue to support the expanding influence of regional gas hubs over time.
… hides the strengthening linkages of regional gas benchmarks
Covid-related market uncertainty puts LNG supply investment on ice while investment in shipping and receiving capacity is robust
The demand uncertainty related to the global pandemic and a historic oil market downturn put the brakes on new investment in liquefaction capacity and upstream gas exploration in 2020. However, LNG vessel orders and investment in LNG regasification projects continued at a healthy clip.
Investment in new liquefaction projects stalled in 2020. After a record year for new final investment decisions (FIDs) in 2019, when nearly 100 bcm of new liquefaction capacity was approved, new FIDs in 2020 were limited to a single train development (the 3.4 bcm Energía Costa Azul project in Mexico).This marks the biggest annual drop in liquefaction project approvals in LNG market history. This investment standstill was due to a combination of excess supply and low global gas price benchmarks, widespread capex cuts by the major national and international oil companies, uncertainty about future LNG demand related to the economic impacts of the pandemic, and a lack of buyer appetite for long-term LNG contracts. The collapse of investment activity raises concerns about long-term supply availability.
Key development milestones, though not a FID, were reached in 2020 for Qatar Petroleum’s 64 bcm LNG expansion project, which could delay concerns of a post-2025 market tightening by several years. Nonetheless, LNG capacity outages in 2020 indicate that supply availability cannot be taken for granted even in a seemingly well-supplied market. For a brief period in Q3 2020, for example, as much as 10% of global liquefaction capacity went offline due to unplanned outages (while another 3% of total capacity was offline for planned maintenance), which contributed to a sudden LNG market tightening in the second-half of 2020.
Spending on gas exploration declined in 2020 amid fresh uncertainties related to the global pandemic and its economic repercussions. The drop in gas exploration is a structural trend, which has been fuelled by abundant unconventional resources (especially in the United States), concerns about stranded asset risk and monetisation challenges in a crowded marketplace for pre-FID LNG projects. Exploration capex for prospective gas plays in 2020 hit the lowest level in at least two decades.
Orders for LNG carrier vessels held up relatively well. After a lacklustre period in Q1-Q3 2020, order activity rebounded sharply in Q4 as the LNG shipping market tightened and spot charter rates skyrocketed. Fleet operators ordered more than 50 new LNG carriers in 2020, about 40% more than the global five-year average, but well below the levels seen in the bumper years of 2018 (77 orders) and 2019 (69 orders). The order book could soon receive another boost as Qatar Petroleum recently announced that it had booked more than 100 slots at one Chinese and several Korean shipyards to meet the vessel requirements of its LNG expansion project. If fully executed, the plan would be the largest shipbuilding programme in the history of LNG.
Investment in new LNG import capacity remained relatively strong in 2020. At the end of 2020, about 194 bcm of regasification capacity was under construction, a 9% increase from the end of 2019. FIDs on as many as eight new regasification projects sustained a robust project pipeline throughout 2020. However, construction delays due to Covid-19 and project-specific issues pushed some anticipated project completions to 2021, which also contributed to the high level of under construction capacity in 2020. Nearly two-thirds of new regasification capacity under development is located in growth markets in Asia, where new infrastructure is required to accommodate increasing gas demand.
Investment activity indicators
Gas market reforms and clean gas policy initiatives take off in 2020
Reforms to open gas markets gained momentum in 2020. This progress can deliver benefits to economies as they recover from the pandemic and its economic consequences. The development of liquid wholesale gas markets typically fosters competition among suppliers, improves allocation efficiency and ensures transparent price discovery.
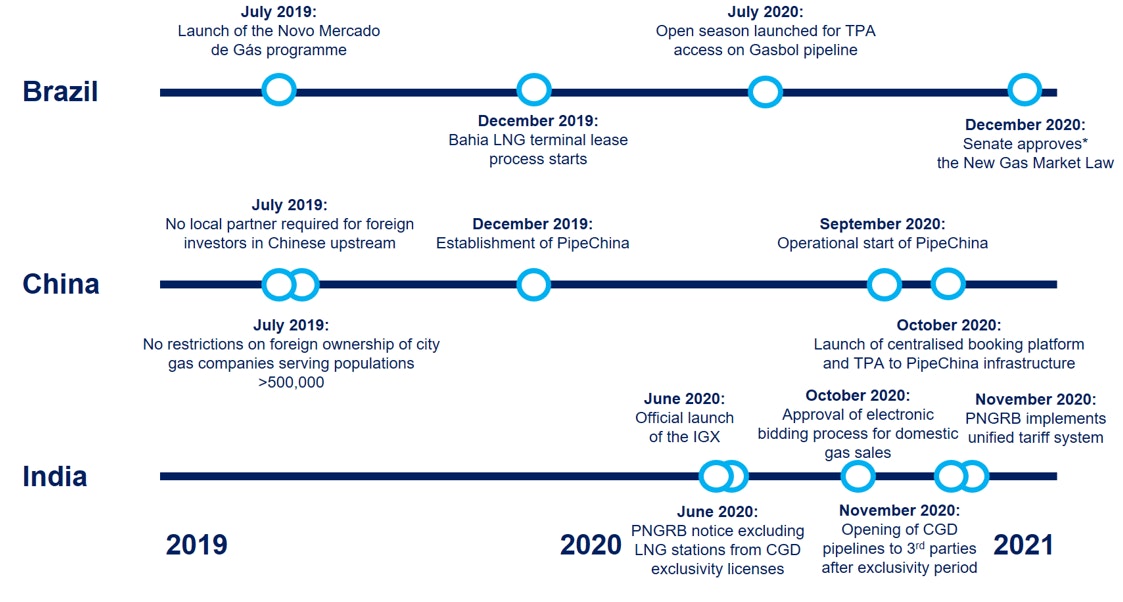
In Brazil, the Novo Mercado de Gas programme was officially launched in July 2019 to establish an open and competitive gas market. Petrobras, the country’s formerly vertically integrated oil and gas company, reached a settlement agreement with the anti-trust regulator, CADE, to fully divest its participation in gas pipeline networks and to guarantee effective third-party access to its infrastructure, including LNG regasification terminals and import pipelines. In August 2020, a proposed new law to further solidify the foundations of a competitive gas market with an entry-exit system, full third-party access to gas infrastructure and a prohibition on vertical integration was approved by the lower house of Brazil’s parliament. In December 2020, the upper house rescinded the bill with amendments to the lower house for final approval.
China launched its new national pipeline company, PipeChina, on 30 September 2020. It marks a significant step towards improved third-party access, better network integration and lower transmission tariffs. The reform may increase market competition, stimulate investment across the natural gas value chain and reduce the cost of gas to end-users. PipeChina has consolidated most of the long-distance gas pipelines as well as six regasification terminals and three underground storage sites that were previously controlled by China’s three state-owned energy majors (PetroChina, Sinopec and CNOOC). The formation of PipeChina follows earlier reforms in July 2019, which removed the remaining ownership restrictions for foreign investors in China’s upstream and downstream gas sector.
India launched the Indian Gas Exchange (IGX) in June 2020, which is authorised to operate as a regulated gas exchange for 25 years. This represents a significant step towards transparent market-based gas pricing, although traded volumes were negligible in the second-half of 2020. The national government enacted reforms to rationalise gas pipeline tariffs (by transitioning to a unified tariff structure from the previous distance-based system) and eased rules to set up LNG fuelling stations. It also approved the creation of an electronic bidding platform where producers will be able to offer their output at market-based prices. India’s gas market regulator extended third-party access to city gas distribution pipelines as exclusivity periods (which run for a minimum of five years) expire. However, CNG stations were excluded from third-party access provisions.
Clean gas policy initiatives
Low-carbon hydrogen is garnering increased attention and a number of countries have announced related targets and strategies. Japan and Korea establised hydrogen roadmaps in 2019. The European Union’s hydrogen strategy set out in July 2020 aims to produce 1 Mt of green hydrogen by 2024 and 10 Mt by 2030. France, Germany, Spain and Netherlands have also launched hydrogen strategies. In Canada, Alberta’s Natural Gas Vision foresees large-scale hydrogen production from natural gas with carbon capture, utilisation and storage by 2030. Canada’s federal government hydrogen strategy set out in December 2020 highlights the potential of clean hydrogen to meet 6% of the country’s energy end-use by 2030 and to expand to 30% by 2050. Chile’s hydrogen strategy targets 5 GW of electrolysers by 2025.
The European Commission put forward a methane strategy in October 2020. It focuses both on reducing methane emissions in the European Union and addressing methane emissions associated with supply chains linked to the European Union. Legislative proposals including on measurement, reporting and verification for all energy-related methane emissions are planned for 2021.
