Cite report
IEA (2023), Cost of Capital Observatory, IEA, Paris https://www.iea.org/reports/cost-of-capital-observatory, Licence: CC BY 4.0
Tools and analysis
Cost of capital is a measure of how investors and financiers price the risks associated with an investment project in a particular country. While a key objective of this new Cost of Capital Observatory is to estimate the range of cost for different types of energy projects in emerging and developing economies, the real value is to understand the reasons that underlie country-by-country variations.
This report proposes a methodology to assess the underlying perceived risks behind the higher financing costs in specific countries, as well as policy actions that can address them. The insights generated by the Observatory can help facilitate the capital flows that are critical to successful clean energy transitions.
Global clean energy investment is picking up, but its distribution is very unequal
The capital costs of key clean energy technologies have been declining (see World Energy Investment 2022, glossary of the Methodology annex, p.19), especially for renewable power, in particular solar photovoltaic and wind power. While absolute capital costs vary by country – depending largely on the sector’s level of policy and regulatory development, as well as the size of the market – cost reductions have been impressive across the world. For instance, utility-scale solar PV costs fell by 50% to 60% between 2015 and 2021 in North America, Europe, People’s Republic of China (hereafter “China”), India, Southeast Asia and sub-Saharan Africa. This has led to important reductions in levelised costs of electricity (LCOEs) from these sources.
LCOEs for utility-scale solar PV projects have reached lows of around USD 40 /MWh in some of the major economies, or even lower in some cases, for projects reaching final investment decision in 2021. LCOEs remain generally higher in emerging and developing economies outside China and India, with an average of around USD 80 /MWh in Brazil, Indonesia, Mexico and South Africa. However, these figures are considerably lower than those prevailing when the Paris Agreement was concluded: the global weighted average was around USD 135/MWh in 2015, with most projects falling in a range of USD 100 to 300 /MWh, according to the 2016 World Energy Outlook. The reduction since then has been driven largely by a virtuous circle of supportive policies, cheaper financing, increased deployment, economies of scale and improved technologies.
Breakdown of LCOE of utility-scale solar PV in selected countries, 2021
|
|
Europe |
United States |
China |
Brazil |
India |
Indonesia |
Mexico |
South Africa |
|---|---|---|---|---|---|---|---|---|
|
Capital costs (USD/kW) |
815 |
1 030 |
610 |
825 |
565 |
985 |
800 |
1 070 |
|
CUF |
15% |
18% |
14% |
16% |
21% |
12% |
20% |
18% |
|
Cost of capital |
|
|
|
|
|
|
|
|
|
Nominal |
4.0% |
4.3% |
4.9% |
13.1% |
9.9% |
10.1% |
9.7% |
10.0% |
|
Real |
3.0% |
3.2% |
4.0% |
9.4% |
7.2% |
8.2% |
7.1% |
6.4% |
|
LCOE (USD/MWh) |
46 |
50 |
39 |
79 |
34 |
111 |
51 |
68 |
Notes: CUF = Capacity utilisation factor. CoC = Cost of capital. The nominal cost of capital is the midpoint of the ranges included in the Cost of Capital Observatory. The LCOEs are calculated using the cost of capital in real terms. For simplicity, LCOEs are shown as a specific value, and not ranges.
The steady downward trend in LCOEs has been disrupted since 2020 by supply chain bottlenecks and higher financing costs. The LCOE of new variable renewable projects could be between 20% and 30% higher in 2022 compared with 2020, according to estimates in the 2022 World Energy Investment report. Yet, the report also highlights that solar PV and wind “remain the most cost-efficient option for new power generation in many countries, even before accounting for the exceptionally high prices seen in 2022 for coal and gas.”
The cost of capital is a major component of renewables’ LCOE but its importance differs by region. Financing costs accounted for around half of the LCOEs of a solar PV plant reaching final investment decision in emerging and developing economies in 2021, compared to 25%‐30% in advanced economies and China (see composition of LCOE figure below), leading to a disproportionate impact on investment spending in emerging and developing economies. Analysis based on Cost of Capital Observatory data shows that the cost of capital for a typical solar PV plant in 2021 was between two‐ and three‐times higher in emerging and developing economies than in advanced economies and China.
Composition of LCOE for a utility-scale solar PV plant with final investment decision secured, 2021
OpenThese contrasting financing costs have tangible consequences in the distribution of investment. After remaining flat for several years, clean energy spending is finally increasing and is set to surpass USD 1.4 trillion in 2022. Yet, most of this investment growth is in advanced economies and China. Despite having two‐thirds of the global population, emerging and developing economies outside China account for less than one‐fifth of total clean energy investment.
What factors push up – or down – the cost of capital?
The cost of capital reflects how much confidence investors have in obtaining an expected return on equity, and how much confidence debt providers have in being paid back the money they have lent. A high cost of capital has a negative impact on investment, especially for capital‐intensive projects such as renewable power generation, which demand large upfront expenses even if they have very low operating costs.
Identifying these perceived risks, understanding which are the most critical in each country, sector or specific project, and putting measures in place to address them, is critical to unlock investments in emerging and developing economies. This section summarises a methodology to quantify and prioritise risks, that allows policymakers – or other interested actors – to understand the reasons for variations in the cost of capital across different jurisdictions and come up with solutions.
The aim is to break down the overall differential in the cost of capital into specific risks, with an indication of their relative importance. This means ranking the different underlying risks in a sector and country and their potential cost, i.e., taking into account both the probability of each risk occurring and the financial impact associated to each risk. Ideally, the distribution of the different risks is known, but this is seldom the case. It requires having historical data on projects and a large number of datapoints to estimate a distribution function. This is often hard to obtain for energy projects in emerging and developing economies, particularly clean energy projects. An alternative when data is scarce or unreliable is to interview experts, a common practice in risk analysis of infrastructure projects.1
- A first step is to estimate the LCOE for a project involving a given technology and country compared with the LCOE for the same technology in a best-in-class country or to a theoretical case where the key LCOE components (capital costs, financing costs and operation and maintenance [O&M] costs) each have best-in-class parameters. For example, one could compare the LCOE of a new utility-scale solar PV project in Indonesia (USD 111/MWh) or Brazil (USD 79/MWh) with the LCOE of Europe (USD 46/MWh).
- The table below presents estimates of LCOEs of utility-scale solar PV for selected countries using the value of the cost of capital in Europe, 3.0% in real terms (as specified in the first table above). Using European cost of capital levels, Indonesia’s LCOE would come down to USD 70/MWh and Brazil’s to USD 45/MWh. The comparison can also be done with another generally lower risk developing or emerging economy that the country in question prefers to use as a benchmark.
Breakdown of LCOE of utility-scale solar PV in selected countries, 2021
|
|
Europe |
United States |
China |
Brazil |
India |
Indonesia |
Mexico |
South Africa |
|---|---|---|---|---|---|---|---|---|
|
LCOE (USD/MWh) |
46 |
50 |
39 |
79 |
34 |
111 |
51 |
68 |
|
LCOE low CoC (USD/MWh) |
46 |
49 |
36 |
45 |
23 |
70 |
35 |
50 |
Notes: CoC = Cost of capital. The ‘LCOE low CoC’ estimates the LCOE using the lowest CoC in Table 1, that of Europe, a rate of 3.0% (real terms).
- The second step to identify the risks perceived by investors and financiers is to create a list of risks that is exhaustive and mutually exclusive (risk categories do not overlap with each other). This list should be tested and calibrated with a few stakeholders to ensure accuracy and to adjust risk categories and/or definitions as needed. Some of these risks may be economy-wide; others will be project-specific.
- In parallel, a list of representative stakeholders should be created, gathering experts from commercial banks, institutional investors, funds – both local and foreign – development finance institutions (especially in emerging and developing economies), and potentially think tanks that have a good understanding of the financing conditions and can provide a more neutral view. Ideally, the group should include at least 15 experts.
- A third step is to hold interviews with the stakeholders identified above, to ask about the probability of each risk occurring (Question A) and the financial impact should the risk materialise (Question B).
Suggested definition of occurrence and impact levels
|
Probability of occurring |
Probability |
Consequence of impact |
Financial impact |
|---|---|---|---|
|
Very high (5) |
Above 80% |
Critical (5) |
Above 60% |
|
High (4) |
Below 80% |
Severe (4) |
Below 60% |
|
Moderate (3) |
Below 50% |
Moderate (3) |
Below 40% |
|
Low (2) |
Below 20% |
Minimum (2) |
Below 10% |
|
Very low (1) |
Below 5% |
Insignificant (1) |
Below 5% |
The aim is to understand the total expected cost of each risk, which is the probability of the risk happening and its potential financial impact. This is done so that, for example, risks that have high probability of occurring but a low financial impact would count similarly to risks that have a low probability of occurring but a high financial impact.
- The fourth step is to group the results together. This is done by calculating a weighted average of answers in the third step. Each expert’s answers of Questions A and B are weighted as per the example in the table below, using an LCOE differential of USD 40/MWh (the estimated LCOE in Indonesia, USD 111/MWh, minus the estimated LCOE in Indonesia using a lower cost of capital, USD 70/MWh, as per the table immediately above).
An example of ranking risks
|
|
Question A (probability of occurring) |
Question B (financial impact) |
Score by risk (Question A* Question B) |
Weighted score |
Weighted effect in LCOE metric (USD/MWh) |
|---|---|---|---|---|---|
|
Risk 1 |
5 |
3 |
5*3=15 |
15/48=0.3125 |
0.3125*40=12.50 |
|
Risk 2 |
3 |
5 |
15 |
0.3125 |
12.50 |
|
Risk 3 |
3 |
1 |
3 |
0.0625 |
2.50 |
|
Risk 4 |
1 |
3 |
3 |
0.0625 |
2.50 |
|
Risk 5 |
4 |
3 |
12 |
0.2500 |
10.00 |
|
Total |
|
|
48 |
1.00 |
40.0 |
Source: IEA analysis based on United Nations (2018), Derisking Renewable Energy Investment, Figure 21.
- The last step is to ask interviewees to suggest instruments that could help reduce the risks, and whether each instrument is available in the country today to what extent would they help reduce LCOEs?
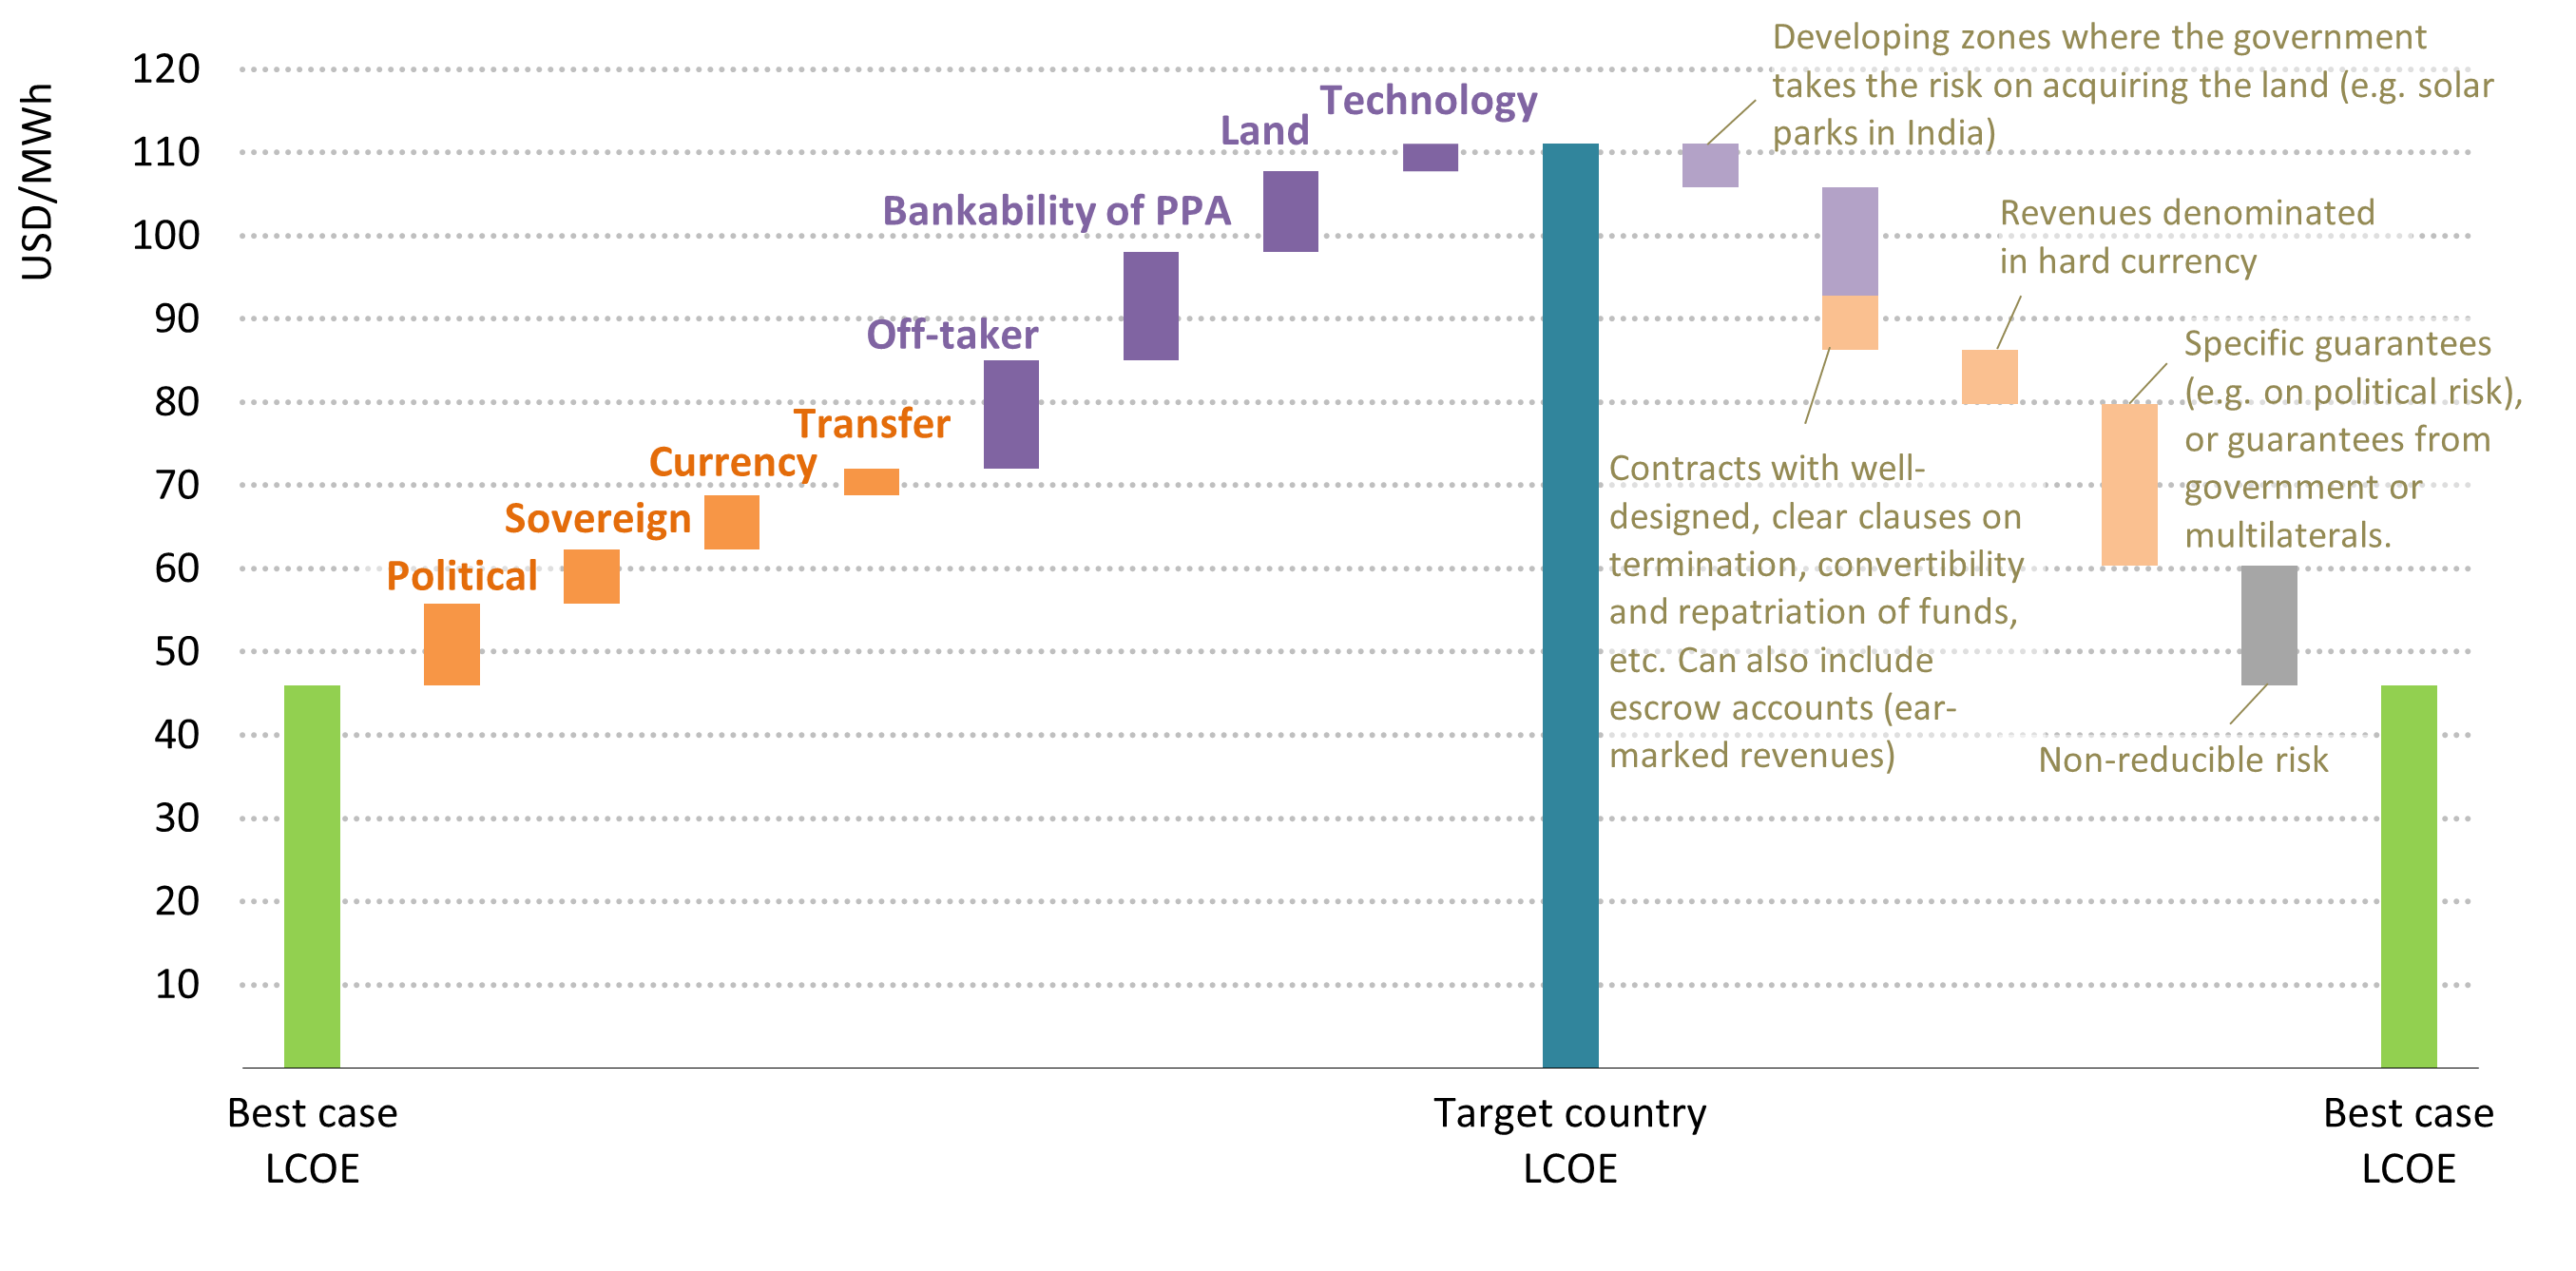
An illustration of such risk decomposition is shown in the figures below, first to break down the risks, and then to identify the solutions. The breakdown of risks is grouped in two categories: economy-wide risks (in orange) and project- or sector-specific risks (in purple). A list and description of these and other risks can be found in the table below.
Main risks associated with renewable energy power projects
|
Risk name |
Description of risk |
|---|---|
|
Political |
Changes in expected revenues/return as a result of political or social instability |
|
Regulatory |
Fear of changes in law/regulation Unclear laws/regulations |
|
Sovereign |
Risk of public debt becoming unsustainable and the government not being able to pay its debt obligations in time and form |
|
Currency |
Risk of changes in foreign exchange rates |
|
Transfer |
Inability – or complicated processes – to convert local currency to hard currency, or to repatriate hard currency |
|
Off-taker |
Delays in the payment of power purchased by off-taker(s) |
|
Bankability of PPA |
Delays in the signing of PPAs; higher-than-expected project costs relative to a fixed-price contract |
|
Land |
Low availability of land High land cost Long lead times Complications arising from overlapping planning permits, fragmented ownership or unregistered land |
|
Transmission network and evacuation |
Insufficient exchange of electricity and system services across states, which can hamper balancing Risks around the infrastructure available to evacuate power (e.g., uncertain availability of local grid connections) |
|
Permitting |
Long lead times |
|
Volume |
Curtailment of power Low electricity demand Meteorological variations |
|
Technology |
Underperformance of technology Little experience of the technology being used in the country Faulty operation and maintenance, etc. |
The right-hand side of the graph shows the identified solutions, the left-hand side has estimates of how each could address some of the economy-wide and project- and sector-specific risks. These solutions may vary depending on the country’s specific conditions, and there may be alternative sets of solutions for a country. For example, if a project could benefit from a government guarantee (e.g., a sovereign guarantee to cover payment defaults by the off-taker), but this is not available, other credit enhancement mechanisms may be required instead, to make the project bankable. Some of these instruments may also not be necessary if there are positive and credible policy or regulatory changes. Last, total de-risking is generally very hard to achieve, or very expensive (as illustrated on the grey column on the right).
Illustrative breakdown of risks that explain country-by-country variations in the levelised cost of electricity for a given clean energy project
Open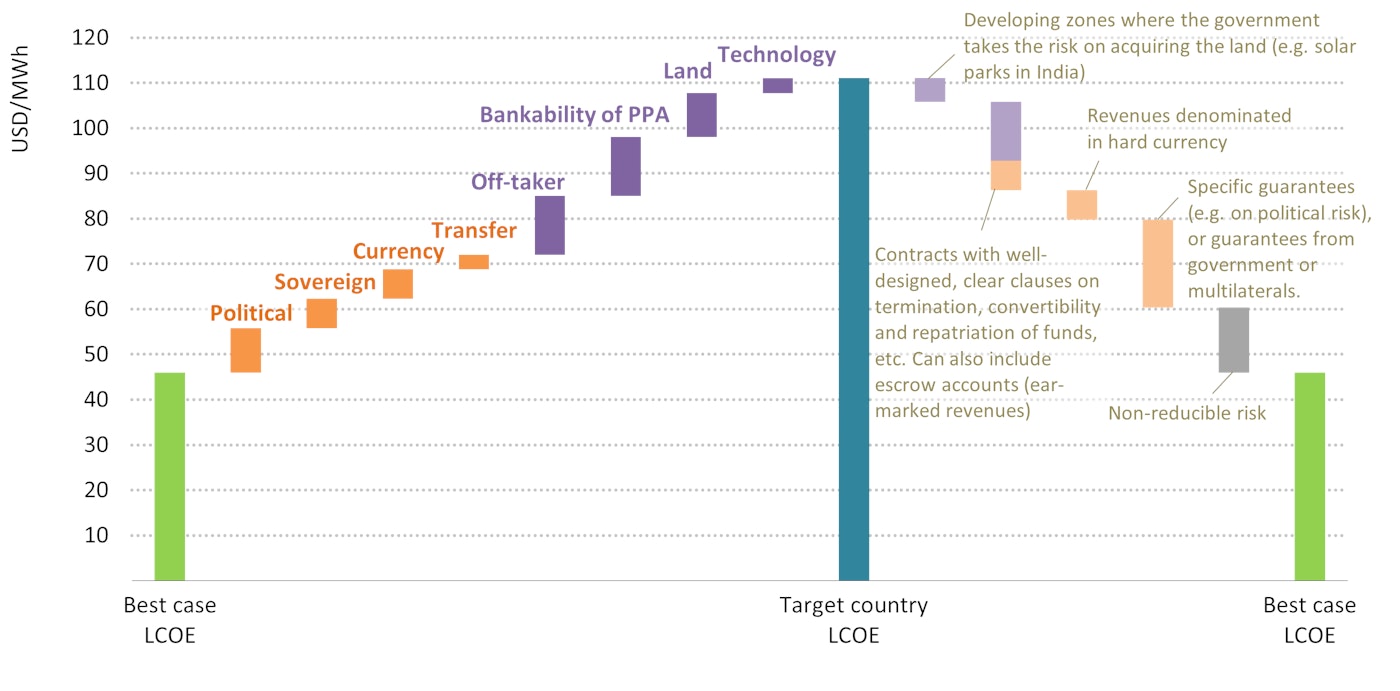
Benefits of a more granular understanding of project risks and solutions
Decomposing country-by-country variations in the cost of capital allows policymakers (or other stakeholders undertaking this exercise) to understand – and easily visualise – which are the most pressing perceived risks they need to address.
Second, it also provides a list of solutions that incorporates the views of investors and financiers (both domestic and international). Setting up and conducting the interviews can take time, but the process is relatively simple and not expensive to undertake. It is subjective in that it collects individual or company views of the sector risks, which is why it is critical to ensure that the list of stakeholders to interview is as representative as possible, and includes neutral and informed actors such as think tanks. It is also important that the exercise is carried out by a credible and neutral party, such as the International Energy Agency.
A final advantage of this methodology is that it quantifies the impacts of the different de-risking solutions, which can then be compared to the cost of each measure, helping governments and development finance institutions decide which to pursue based on a cost-benefit analysis. For example, if the average cost of capital of the emerging and developing countries were to be lowered to that in Europe, this would reduce the financing costs for solar PV projects by a cumulative of USD 1 trillion over the period to 2050 in the Announced Pledges Scenario and by about USD 1.8 trillion in the Net Zero Emissions by 2050 Scenario. These reductions correspond to around half of the total investment requirements for solar PV projects, including financing costs.
The IEA has experience implementing the methodology laid out in this report, as seen in the 2021 India Energy Outlook (figure 4.20), and is looking to continue doing this in a more systematic and comprehensive manner in select emerging market and developing economies. Ideally, the next cases would be in one of the five countries where cost of capital data has been compiled by the Observatory. Governments or donor agencies working with emerging market and developing economies who are interested in partnering with the IEA should contact the Energy Investment Unit of the IEA (investment@iea.org).
References
Corporacion Nacional para el Desarrollo (2018), “Defining Value for Money,” https://www.gub.uy/ministerio-economia-finanzas/sites/ministerio-economia-finanzas/files/inline-files/manual_valor_por_dinero.pdf
Reference 1
Corporacion Nacional para el Desarrollo (2018), “Defining Value for Money,” https://www.gub.uy/ministerio-economia-finanzas/sites/ministerio-economia-finanzas/files/inline-files/manual_valor_por_dinero.pdf