Cite report
IEA (2020), Clean Energy Innovation, IEA, Paris https://www.iea.org/reports/clean-energy-innovation, Licence: CC BY 4.0
Report options
Innovation needs in the Sustainable Development Scenario
Highlights
- Innovation is central to the Sustainable Development Scenario. Almost 35% of the cumulative CO2 emissions reductions seen in the Sustainable Development Scenario by 2070 compared with the current trajectory come from technologies that are currently at the prototype or demonstration phase and that will not become available at scale without further R&D (including commercial demonstrators) and technical improvements. A further 40% of the cumulative emissions reductions rely on technologies that have not yet been commercially deployed in mass‑market applications.
- Without strong and targeted R&D efforts in critical technologies, net-zero emissions are not achievable. The main routes for the energy sector to achieve net-zero emissions are well known: electrification of end-use sectors; the use of CO2 capture, utilisation and storage, including to remove CO2 from the atmosphere; the use of low-carbon hydrogen and hydrogen-based fuels; and the use of bioenergy. However, each of these routes faces technology challenges to commercialise all steps of its value chain to tackle emissions in sectors that currently have no available scalable low-carbon options.
- Bringing new energy technologies to market can take several decades. Even successful examples in clean energy technology development like solar PV, lithium-ion batteries or LED took between 10 and 30 years from the first prototype to the time of commercialisation. The Sustainable Development Scenario assumes that concerted policy efforts speed up innovation timelines for new energy technologies so that innovation happens at least as fast as it has ever done before. This requires the efficient transmission of knowledge from first-mover countries to those that follow, particularly in the most critical early adoption phase.
- Different technologies have different attributes that can favour or hold back rapid innovation cycles. Technologies that are small and modular are less capital-intensive than large engineering solutions, for example, and this reduces their investment risks in the development phase. They also allow for standardisation and mass production, which in turn encourages innovation through competition and brings improved products to market faster. Synergies between sectors can accelerate further those cycles.
- Knowledge accumulated in one technology area can be of great relevance and value in related technologies. Such “spillovers”, often overlooked, are very important because the benefits they bring can be harnessed at relatively low cost and can avoid the need for additional R&D. In the Sustainable Development Scenario, innovation policy stimulates these synergies, and this leads to technology areas with strong spillover potential including electrochemistry for batteries, electrolysers and fuel cells contributing 30% of the cumulative emissions reductions to 2070 compared to the current trajectory.
Introduction
Clean energy technology innovation has a vital role to play in achieving a rapid reduction in emissions of greenhouse gases to zero on a net basis over the coming decades, in line with the United Nations energy-related Sustainable Development Goals (SDGs), including the climate goal of the Paris Agreement.
The Paris Agreement of 2015 set a goal of “holding the increase in the global average temperature to well below 2°C above pre-industrial levels and pursuing efforts to limit the temperature increase to 1.5°C above pre-industrial levels”. It also calls for greenhouse gas emissions to peak as soon as possible and for a rapid reduction thereafter in order to achieve a global balance between anthropogenic emissions by sources and removals by sinks of greenhouse gases – net-zero emissions – in the second-half of this century. Net-zero emissions requires that any remaining anthropogenic emissions are entirely offset by negative emissions from changes in land-use systems or the removal of greenhouse gases through bioenergy with carbon capture and storage (BECCS) or the direct capture of CO2 (DAC) from the air.
The Paris Agreement goal does not correspond to a single pathway for energy sector CO2 emissions1 or a specific date for achieving net-zero emissions, both because that goal spans a range of outcomes and because the required trajectory of the energy sector depends on emissions from outside the energy sector, as well as emissions of other greenhouse gases and air pollutants that also have climate effects. The precise timing of the need for overall net-zero greenhouse gas emissions worldwide also depends on how soon the peak in emissions is achieved and the rate at which emissions are subsequently reduced.
In this chapter, we use the IEA’s Sustainable Development Scenario to assess the contribution needed from clean energy technology innovation for a clean energy transition to net-zero CO2 emissions by 2070. The Sustainable Development Scenario describes the broad evolution of the energy sector that would be required to reach the key energy-related goals of the United Nations, including the climate goal of the Paris Agreement (SDG 13), universal access to modern energy by 2030 (SDG 7), and a dramatic reduction in energy-related air pollution and the associated impacts on public health (SDG 3.9).
The Sustainable Development Scenario would limit the global temperature rise to below 1.8°C with a 66% probability if CO2 emissions remain at net zero after 2070. If CO2 emissions were to fall below net zero after 2070, then this would increase the possibility of reaching 1.5°C by the end of the century: the extent to which it would increase the possibility would depend on the level of carbon removal eventually reached. Reaching such negative emissions is a very common feature of the scenarios assessed by the Intergovernmental Panel on Climate Change in its special report: 88 out of the 90 scenarios in the report assume some level of net negative emissions.2
How ready is the energy system for net-zero emissions?
Technological change – the development and diffusion of technology to meet growing demand or displace existing energy assets – drives the clean energy transition in the Sustainable Development Scenario. Most of the capital stock that makes up today’s energy system, from supply to end-use, will need to be adapted or transformed to reach the goal of net-zero emissions. To reach net-zero emissions globally in five decades, major reductions in cost and improvements in performance will be needed in a wide range of technologies already in use or in the early stages of development.
Developing a new technology and successfully bringing it to market is typically a long drawn-out process. Technologies go through a journey in which they evolve from a concept to a prototype, are demonstrated at scale and, if successful, are adopted and commercialised more widely. Given that we cannot predict the emergence of technologies that are not known today or which ideas might prove successful, the portfolio of energy technologies in the Sustainable Development Scenario includes those for which at least a large prototype is already proven today and the pathway to commercial scaling-up is understood, which means that that basic information on potential technology performance and costs is available. There are, nonetheless, a variety of factors that could delay or disrupt the clean energy transition in practice, including unexpected future events and the hard-to-predict responses of companies, investors and governments to such events.
Almost 35% of the cumulative emissions reductions by 2070 in the Sustainable Development Scenario compared with the Stated Policies Scenario3 hinge on technologies that are currently at large prototype or demonstration phase, and around 40% on technologies that are not yet commercially deployed at a large scale. The contribution of technologies at large prototype or demonstration stage to emissions reductions are even higher in heavy industry and long-distance transport, where no commercially available and scalable options for achieving deep emissions reductions exist today.
Global energy sector CO2 emissions reductions by current technology readiness category in the Sustainable Development Scenario relative to the Stated Policies Scenario, 2019-2070
OpenThe energy trajectories in the Sustainable Development Scenario are largely determined by how the cost and technical performances of competing technologies evolve through innovation, but are also affected by changing policy priorities and consumer choices. All these factors are interlinked and interact dynamically over time. For example, the pace of decline in the cost of lithium-ion (Li-ion) batteries influences the rate of take-up of electric vehicles, which affects how competitive they are against biofuels as a means of decarbonisation, particularly in light‑duty vehicles. Other factors, including battery capacity, efficiency and (dis)charge power, also play a role in determining the attractiveness of electric vehicles, as in determining the economic viability of using Li-ion batteries to provide storage for electricity systems. Deployment is both a cause and effect of cost and performance for each of the technologies that drive the transition to net-zero emissions: the faster their take-up, the greater the economies of scale and learning effects, and the greater the incentives to seek out incremental gains through yet more innovation in a virtuous cycle.
Technological change is a key driver of the clean energy transition in the Sustainable Development Scenario, but not the only one. Consumer behaviour with respect to how much and what type of energy services and commodities are consumed changes considerably in that scenario, both in response to increasing public consciousness about the nefarious environmental and societal impact of current consumption patterns and to changes in price signals. In the Sustainable Development Scenario, there is a fundamental change in how households interact with the energy system as distributed generation and demand-response strategies take root and spread, while the transport system shift towards less emissions-intensive modes of travel, such as public transport, rail and car-sharing. Consumers and producers are active players in material efficiency measures such as the renovation of buildings, the reuse and recycling of goods, and the way products are designed to facilitate sustainable end-of-life management strategies. Strategies that avoid creating the demand for a given service (e.g. shared mobility or plastics recycling) enable 7% (or almost 80 Gt) of cumulative emissions reductions to 2070 in the Sustainable Development Scenario compared to the Stated Policies Scenario.4
The impact of the Covid-19 pandemic on energy use and CO2 emissions
IEA analysis of the effects of the Covid-19 pandemic on energy use and CO2 emissions shows that 2020 could see a drop in global energy-related CO2 emissions of almost 8%. This would be the largest reduction ever over the course of a year, six times larger than the previous record reduction of 0.4 Gt in 2009 due to the financial crisis, and twice as large as the combined total of all previous reductions since the end of World War II.
Based on data for the first four months of 2020, and on the assumption of a gradual recovery in the global economy, the IEA expects total primary energy demand in 2020 to drop in all major regions and to contract globally by around 6%. This includes an 8% decline in oil demand, an 8% reduction in coal demand, a 5% fall in natural gas demand and a 5% drop in electricity demand. As a result, global CO2 emissions in 2020 are expected to fall by around 2.5 Gt to just under 31 Gt, around 8% lower than in 2019. This would be the lowest level since 2010. However, as nearly all of this decline is due to reductions in economic activity rather than structural changes in the way the world produces and consumes energy, emissions are very likely to rebound as economies recover, unless there is swift action to bring about such structural changes.
These staggering numbers give a sense of just how radical shifts in technology and consumer behaviour would need to be in order bring about a considerable and permanent reduction in CO2 emissions while the global economy continues to grow and the global population continues to increase. They underscore the need for a structural transformation in the way energy and goods are produced and consumed, which is realised simultaneously through technological change and radical changes of consumption patterns so as to deliver a clean energy transition that meets both sustainability and economic prosperity objectives.
The critical role of innovation in the Sustainable Development Scenario highlights the need for an efficient innovation cycle to reach net-zero emissions in the most cost-effective manner. This means making sure that researchers are funded to come up with potentially powerful new ideas, that strong links are in place between R&D institutions and industrialists, that today’s prototypes are given the best possible chance of reaching their full potential and that the scaling-up of technologies as they enter the market is accompanied by continual improvements. Achieving net-zero emissions smoothly and quickly calls for any bottlenecks in innovation – such as insufficient flows of capital, knowledge or funding – to be avoided by learning from past experiences.
The speed at which energy-producing and energy-consuming equipment would have to be replaced and new technologies introduced in the Sustainable Development Scenario is as fast as has ever been seen in the history of energy. For those technologies at an early stage of development today, diffusion time would need to be reduced by several decades compared with historical averages. But just because this transformation would be unprecedented does not make it impossible. Many of the technologies needed in the Sustainable Development Scenario rely on digitalisation, for example, making them unlike energy technologies of the past, and on rapid adoption by consumers, who are operating in a world in which information spreads faster than ever before. Other technologies require extensive new infrastructure and reduced efficiencies (e.g. integrating carbon capture), but are backed by strong social and regulatory pressure for change.
The projections in the Sustainable Development Scenario are underpinned by an extensive body of analysis of the interaction of energy innovation and deployment, informed by case studies of how key technologies have emerged in the past. The rest of this chapter looks at the timescales involved in taking emerging technologies from the laboratory to the market, how learning-by-researching and learning-by-doing affect cost reductions, and the specific technology attributes that are known to influence the pace and success of innovation over time. It also explains how all these factors are incorporated into the Sustainable Development Scenario.
Assessing technology readiness: The ETP Clean Energy Technology Guide
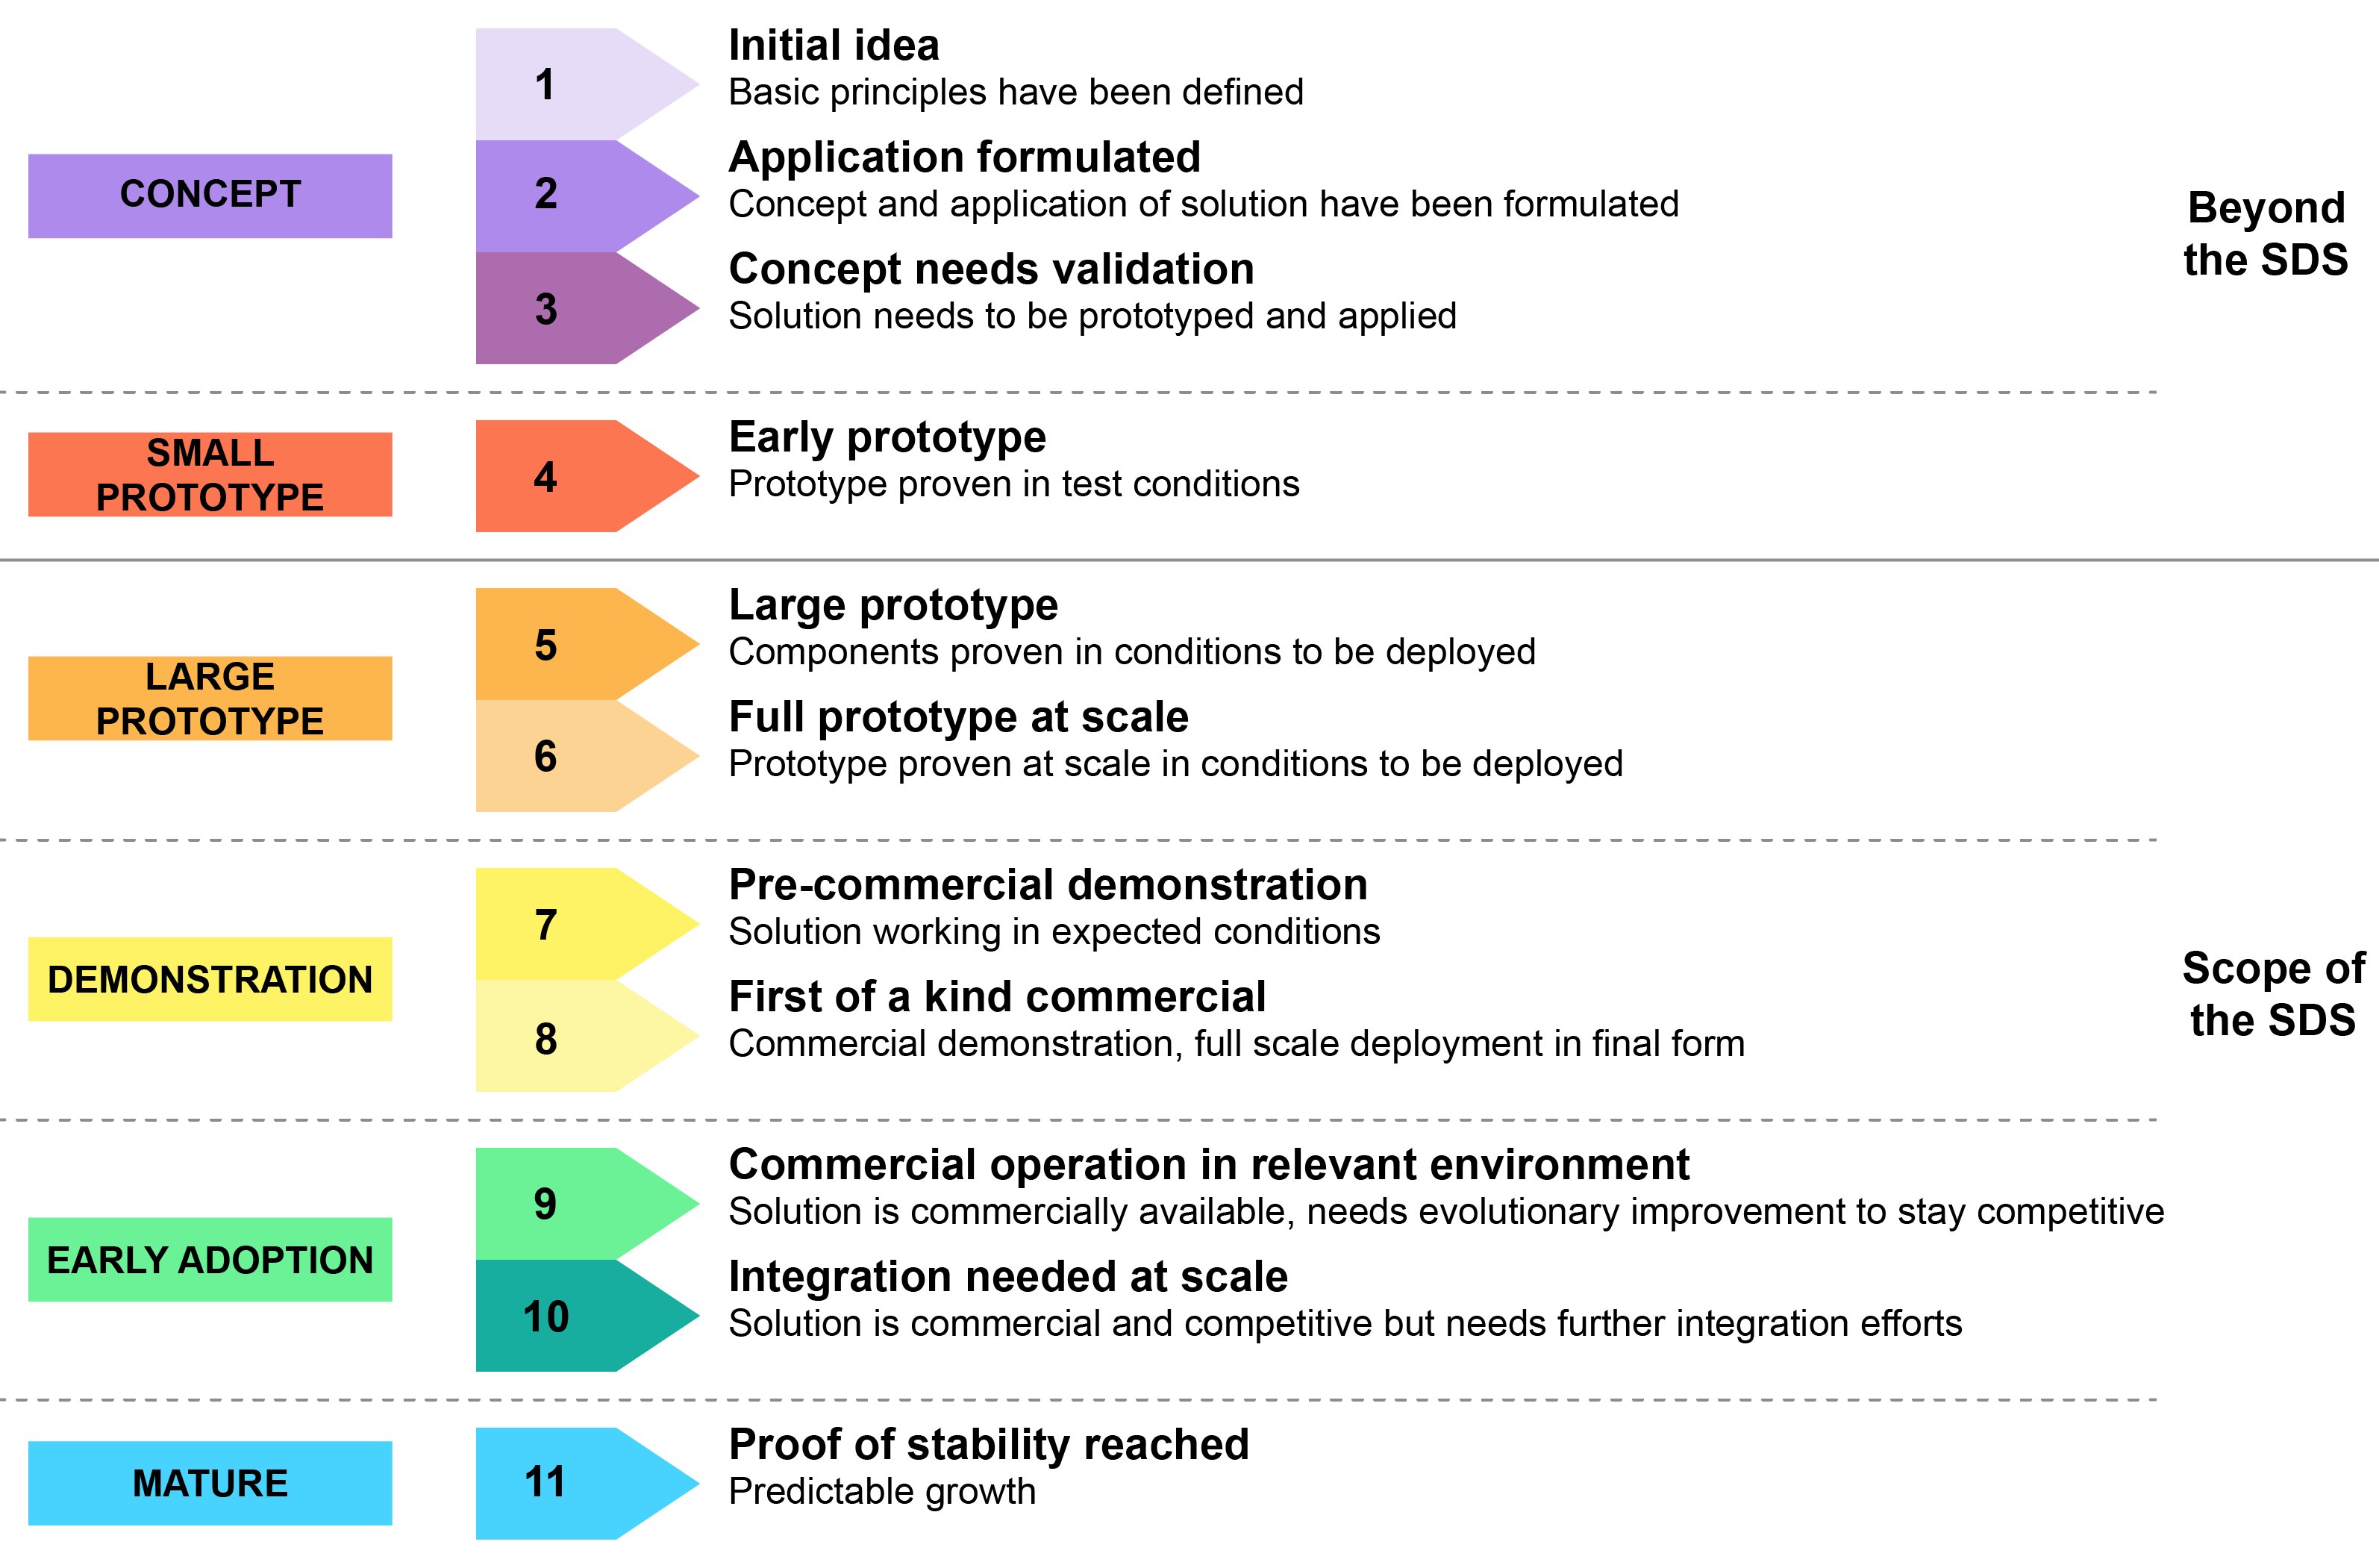
One way to assess where a technology is on its journey from initial idea to market is to use the technology readiness level (TRL) scale. Originally developed by the National Aeronautics and Space Administration (NASA) in the United States in the 1970s and used in many US government agencies since the 1990s, the TRL provides a snapshot in time of the level of maturity of a given technology within a defined scale (Mankins, 1995). The US Department of Defence has been using the TRL scale since the early 2000s for procurement, while the European Space Agency adopted it in 2008. In 2014, the TRL was applied for the first time outside the aerospace industry to assess EU funded projects as part of the Horizon 2020 framework programme. It is now widely used by research institutions and technology developers around the world to set research priorities and design innovation support programmes.
The scale provides a common framework that can be applied consistently to any technology to assess and compare the maturity of technologies across sectors. The technology journey begins from the point at which its basic principles are defined (TRL 1). As the concept and area of application develop, the technology moves into TRL 2, reaching TRL 3 when an experiment has been carried out that proves the concept. The technology now enters the phase where the concept itself needs to be validated, starting from a prototype developed in a laboratory environment (TRL 4), through to testing in the conditions it which it will be deployed (TRL 6). The technology then moves to the demonstration phase, where it is tested in real-world environments (TRL 7), eventually reaching a first-of-a-kind commercial demonstration (TRL 8) on its way towards full commercial operation in the relevant environment (TRL 9).
Arriving at a stage where a technology can be considered commercially available (TRL 9) is not sufficient to describe its readiness to meet energy policy objectives, for which scale is often crucial. Beyond the TRL 9 stage, technologies need to be further developed to be integrated within existing systems or otherwise evolve to be able to reach scale; other supporting technologies may need to be developed, or supply chains set up, which in turn might require further development of the technology itself. For this reason, the IEA has extended the TRL scale used in this report to incorporate two additional levels of readiness: one where the technology is commercial and competitive but needs further innovation efforts for the technology to be integrated into energy systems and value chains when deployed at scale (TRL 10), and a final one where the technology has achieved predictable growth (TRL 11).
As technologies pass through each stage, the level of risk associated with technology performance is reduced, but the level of overall risk rises as capital expenditure requirements grow. However, innovation is rarely a linear progression. Not all technology designs make it to market or get deployed at scale. Stages of development can accelerate or slow down depending on technical or cost factors, and a given technology can be at different stages in different markets and applications. As the development of a technology generates new ideas for improvements, alternative configurations and potentially better components can appear even once a given technology configuration has become competitive. Stages overlap and run concurrently, feeding on one another.
Technology readiness level scale applied by the IEA
Open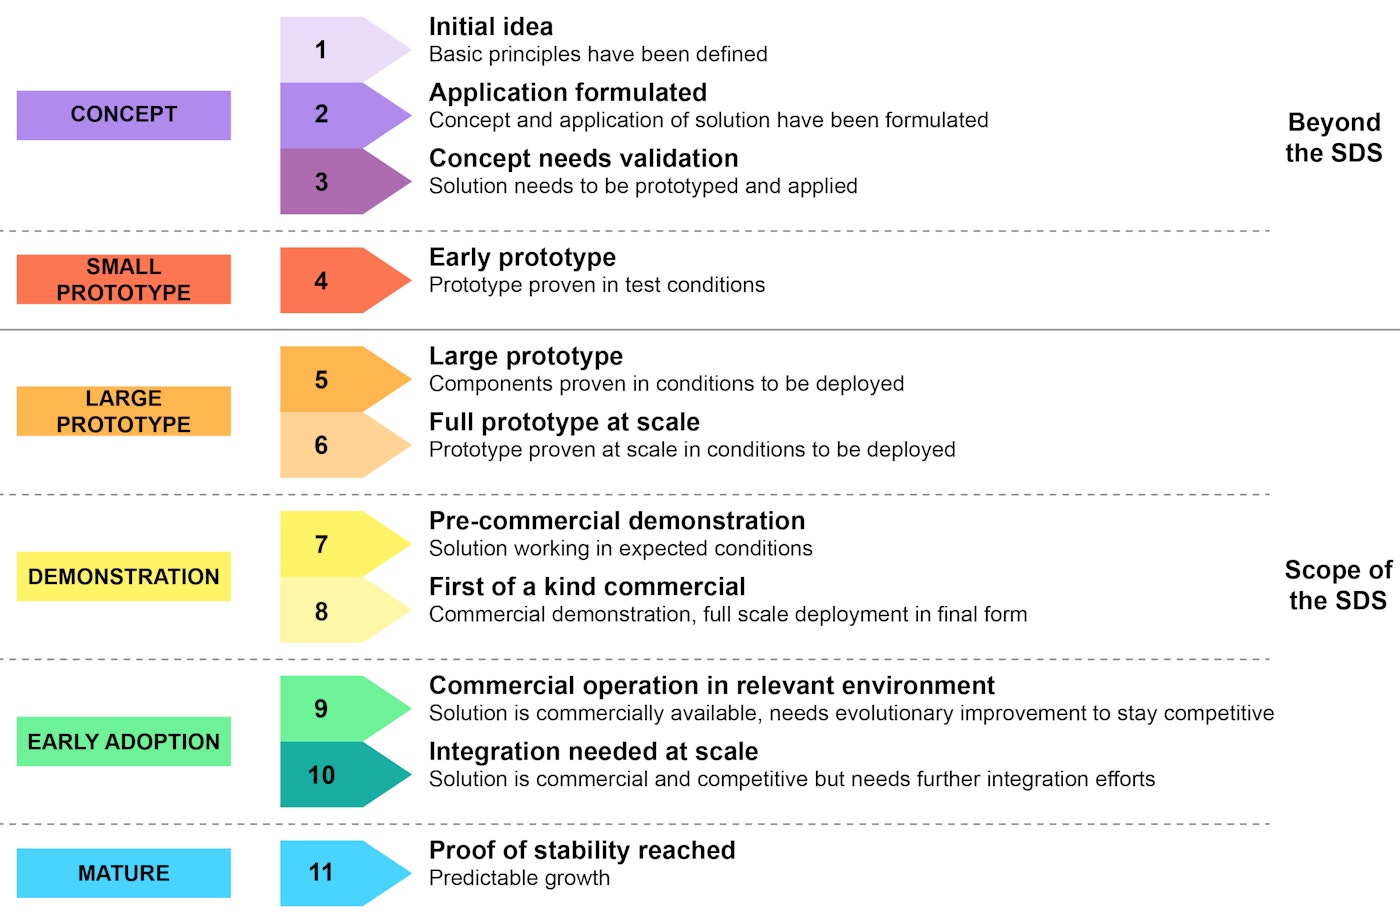
To inform this analysis, we have analysed the technology readiness of almost 400 individual technology designs and components, and have structured them hierarchically alongside others delivering the same service in what we refer to as the ETP Clean Energy Technology Guide. This is an interactive framework that includes information on the level of maturity of different technology designs and components, as well as a compilation of cost and performance improvement targets and leading players in the field. 60% of the technology designs and components analysed are not commercially available today, and 35% are at the early adoption phase, meaning that they are still significantly dependent on innovation to improve performance and reduce costs. Of the mature technology designs assessed, 65% relate to the buildings and power generation sectors: a higher proportion of the technologies in industry, transport and fuels transformation have lower TRLs.
In this report we refer to four broader readiness categories, each of which comprises different ranges of specific readiness levels from the full TRL scale: mature, early adoption, demonstration and prototype. Each technology type is assigned to one of these higher level categories based on the granular levels of maturity of individual technology designs or components today associated with that technology.
- “Mature” for commercial technology types that have reached sizeable deployment and for which only incremental innovations are expected. Technology types in this category have all designs and underlying components at TRL 11. Hydropower and electric trains are examples.
- “Early adoption” for technology types for which some designs have reached markets there are competing designs being validated at demonstration and prototype phase. Technology types in this category have at least an underlying design at TRL ≥ 9 and others at lower TRLs. Offshore, wind, electric batteries and heat pumps are examples.
- “Demonstration” for technology types for which designs are at demonstration stage or below, meaning no underlying design at TRL ≥ 9, but at least a design at TRL 7 or 8. Carbon capture in cement kilns, electrolytic hydrogen-based ammonia and methanol, and large long-distance battery-electric ships are examples.
- “Large prototype” for technology types for which designs are at prototype stage of a certain scale, meaning no underlying design at TRL 7 or 8 but with at least one design at TRL 5. Ammonia powered vessels, electrolytic hydrogen-based steel production and direct air capture are examples.
- “Small prototype” for technology types for which designs are at early prototype stage, meaning no underlying design at TRL 5, but with at least one design at TRL 4. Battery-electric aircrafts and direct electrification of primary steelmaking are examples.
- “Concept” for applications that have just been formulated but that need to be validated. Lithium-air batteries and electrifying a steam cracker for olefins production are examples.
Number of clean energy technology designs and components analysed in the ETP Clean Energy Technology Guide
OpenReadiness of critical low-carbon value chains
The Sustainable Development Scenario identifies key decarbonisation strategies. The electrification of the transport, industry and buildings sectors combined with the deployment of renewables in power generation accounts for about 40% of the cumulative reduction in emissions by 2070 in the Sustainable Development Scenario, relative to the Stated Policies Scenario. The shift towards more sustainable alternative fuels and feedstock such as bioenergy, hydrogen and hydrogen-derived synthetic fuels (using low-carbon hydrogen and sustainable carbon sources) accounts for around 20%. The deployment of carbon capture utilisation and storage (CCUS) systems, including those allowing for negative emissions and for low-carbon hydrogen production, accounts for almost 15% more. For these decarbonisation strategies to be rolled out, innovation is needed to bring new technologies to market and to improve emerging ones along all the different steps of the involved value chains.
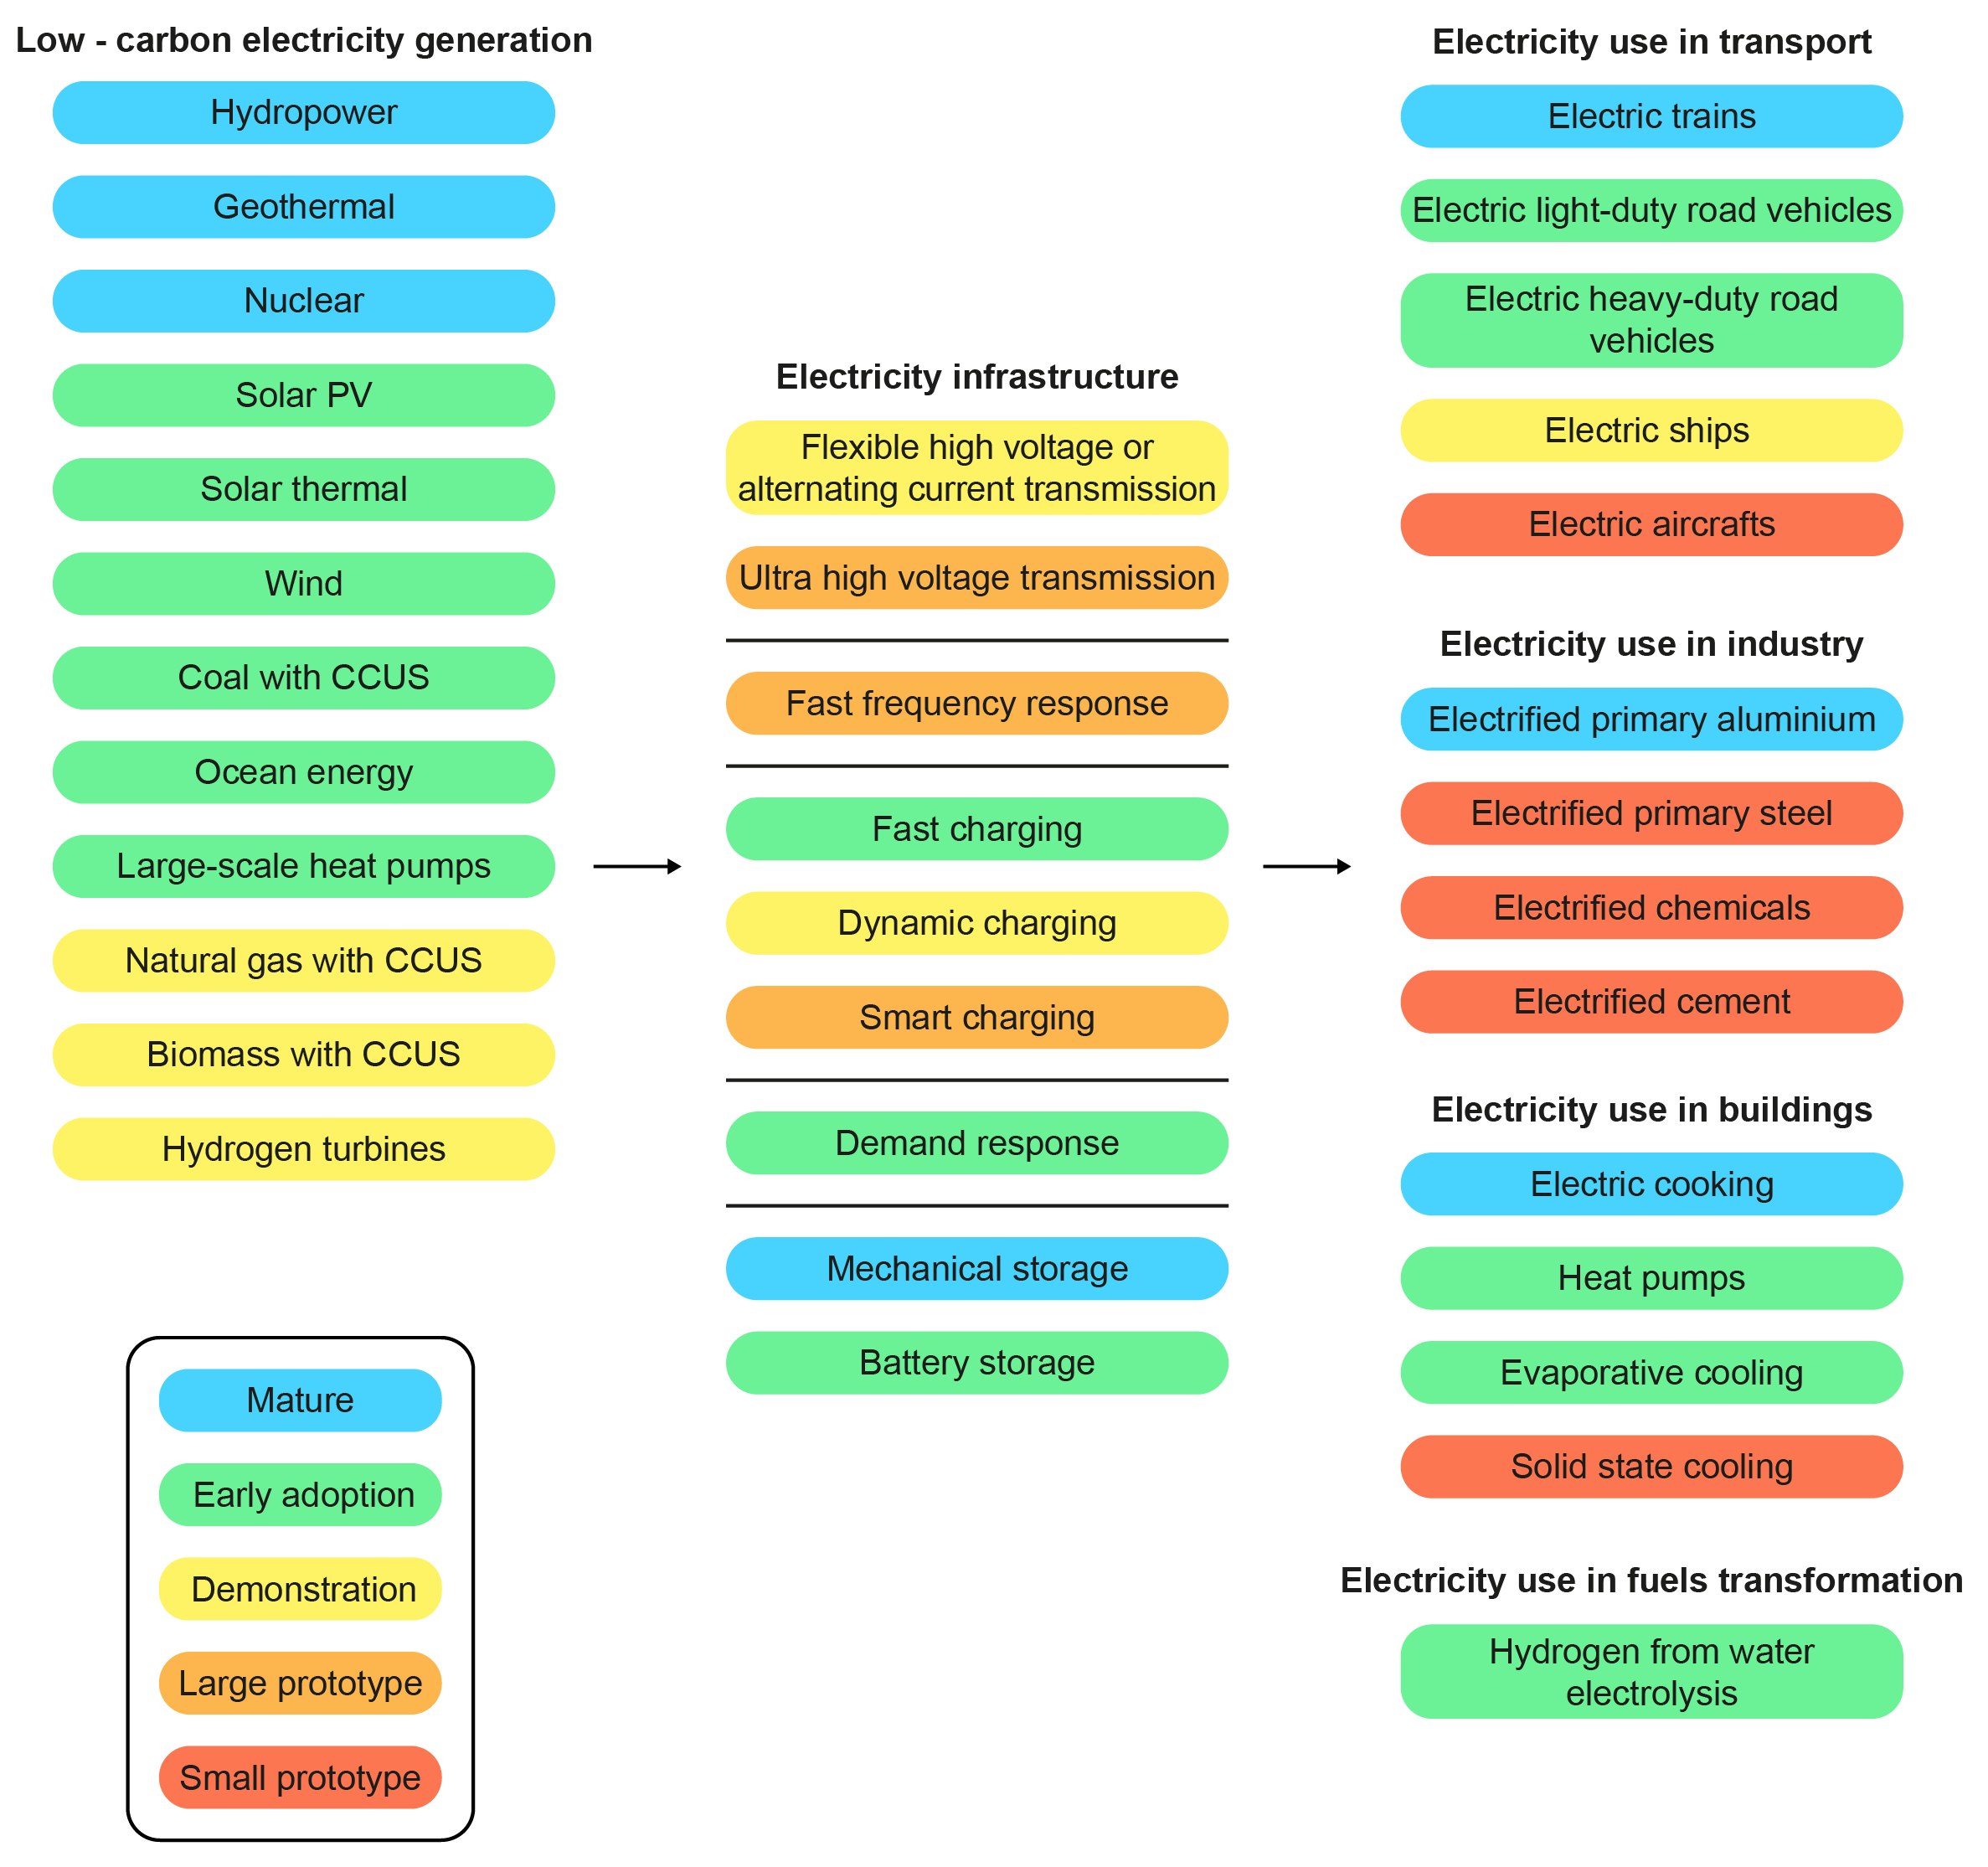
In the low-carbon electricity value chain, several technologies have reached maturity, but there is still a long way to go for others This is particularly true in demand areas such as heavy industry and long-distance transport that are proving difficult to electrify: some key technologies in these areas are today still at small prototype stage or below. The same point applies in other areas too. Innovation to develop effective integration measures that provide greater flexibility to lower carbon electricity grids is becoming increasingly important: relevant technologies today are, however, generally between the early adoption and large prototype stages. In end-use sectors, some technologies such as electric vehicles and heat pumps are commercially available, but innovation remains an important issue: their ability to expand their markets depends on further technology innovation to improve performance and reduce costs.
Technology readiness level of technologies along the low-carbon electricity value chain
Open
The capture, transport and utilisation or storage of CO2 emissions as a successful decarbonisation strategy hinges on the commercial availability of technologies at each stage of the process as well as on the development and expansion of CO2 transport and storage networks at a sizeable scale.
Capture: While CO2 has been captured for decades in certain industrial and fuel transformation processes such as ammonia production and natural gas processing, it has just commercially emerged or is still being demonstrated at a large scale in many of the other possible applications. In each of these potential new applications, which range from power generation and fuels transformation to cement and iron and steel production, a wide range of CO2 separation techniques needs to be tailored to the particular conditions of each individual process. Chemical absorption is the CO2 separation technique for which there is the most operational experience, and it is currently used in commercial capture facilities and embedded in demonstration plants for most applications across different sectors. Chemical absorption is therefore the CO2 separation technique the most widely used over the next two decades in the Sustainable Development Scenario.
Use: CO2 is used commercially today in a few industries; it is, for instance, used in the production of urea (the main precursor of nitrogen-based fertilisers) and of carbonated drinks. In both applications, CO2 is only stored temporarily and is ultimately released to the atmosphere. Other potential uses of CO2 are emerging: they include building materials (which would provide long‑term but not permanent CO2 storage) and feedstock for synthetic fuels (which would prevent the CO2 from being released into the atmosphere only temporarily).5
Storage: CO2 has been used for enhanced-oil recovery for more than five decades; this counts as a form of storage because the vast majority of the CO2 is retained in the reservoir over the life of the project. Most of the CO2 used is sourced from natural reservoirs, but an increasing amount comes from CO2 captured from industrial sources. However, there is relatively limited experience in operating at scale other geological storage options. There are 5 large-scale facilities currently storing more than 7 MtCO2/year in saline formations, one of which has been operating since 1995 (the Sleipner CCS project). CO2 storage in depleted oil and gas wells has been limited to pilot demonstrations, but there are plans to develop commercial facilities.
Negative emissions: Biomass-based CO2 emissions capture and storage and direct air capture (DAC) both have the ability to yield negative emissions, and therefore have considerable potential long-term importance. With a few exceptions, however, neither technology has yet reached markets at a large scale.6 Some demonstration plants and pilots have been completed, and in some cases they have been maintained in operation, particularly when a suitable commercial use for the captured CO2 was found nearby. Several small pilot-scale DAC plants are currently operating around the world: they incorporate commercial facilities that sell the captured CO2.
Technology readiness level of technologies along the CO2 value chain
Open
The value chain for low-carbon hydrogen is not completely developed at commercial scale today. It comprises many technologies that are necessary to produce, transport, store and consume low-carbon hydrogen, each of them at a different stage of maturity and facing specific technical challenges. Among the low-carbon hydrogen production routes that are commercially available today, the use of electrolytic hydrogen in heavy industrial processes is less advanced (i.e. just at the demonstration stage) than that of natural gas with CCUS with facilities in operation. Setting to one side its long-standing use in oil refining and chemical production, hydrogen use today is limited by current commercially viable technologies to light-duty vehicles, space heating, and electricity generation in buildings and distributed electricity systems.7 Large portions of the full potential demand for hydrogen will remain untapped until technologies are developed to use hydrogen in iron and steel and heavy-duty transport, and until fuels derived from low-carbon hydrogen (for example synthetic hydrocarbon fuels and ammonia), are demonstrated at commercial scale and then deployed.
Technology readiness level of technologies along the low-carbon hydrogen value chain
Open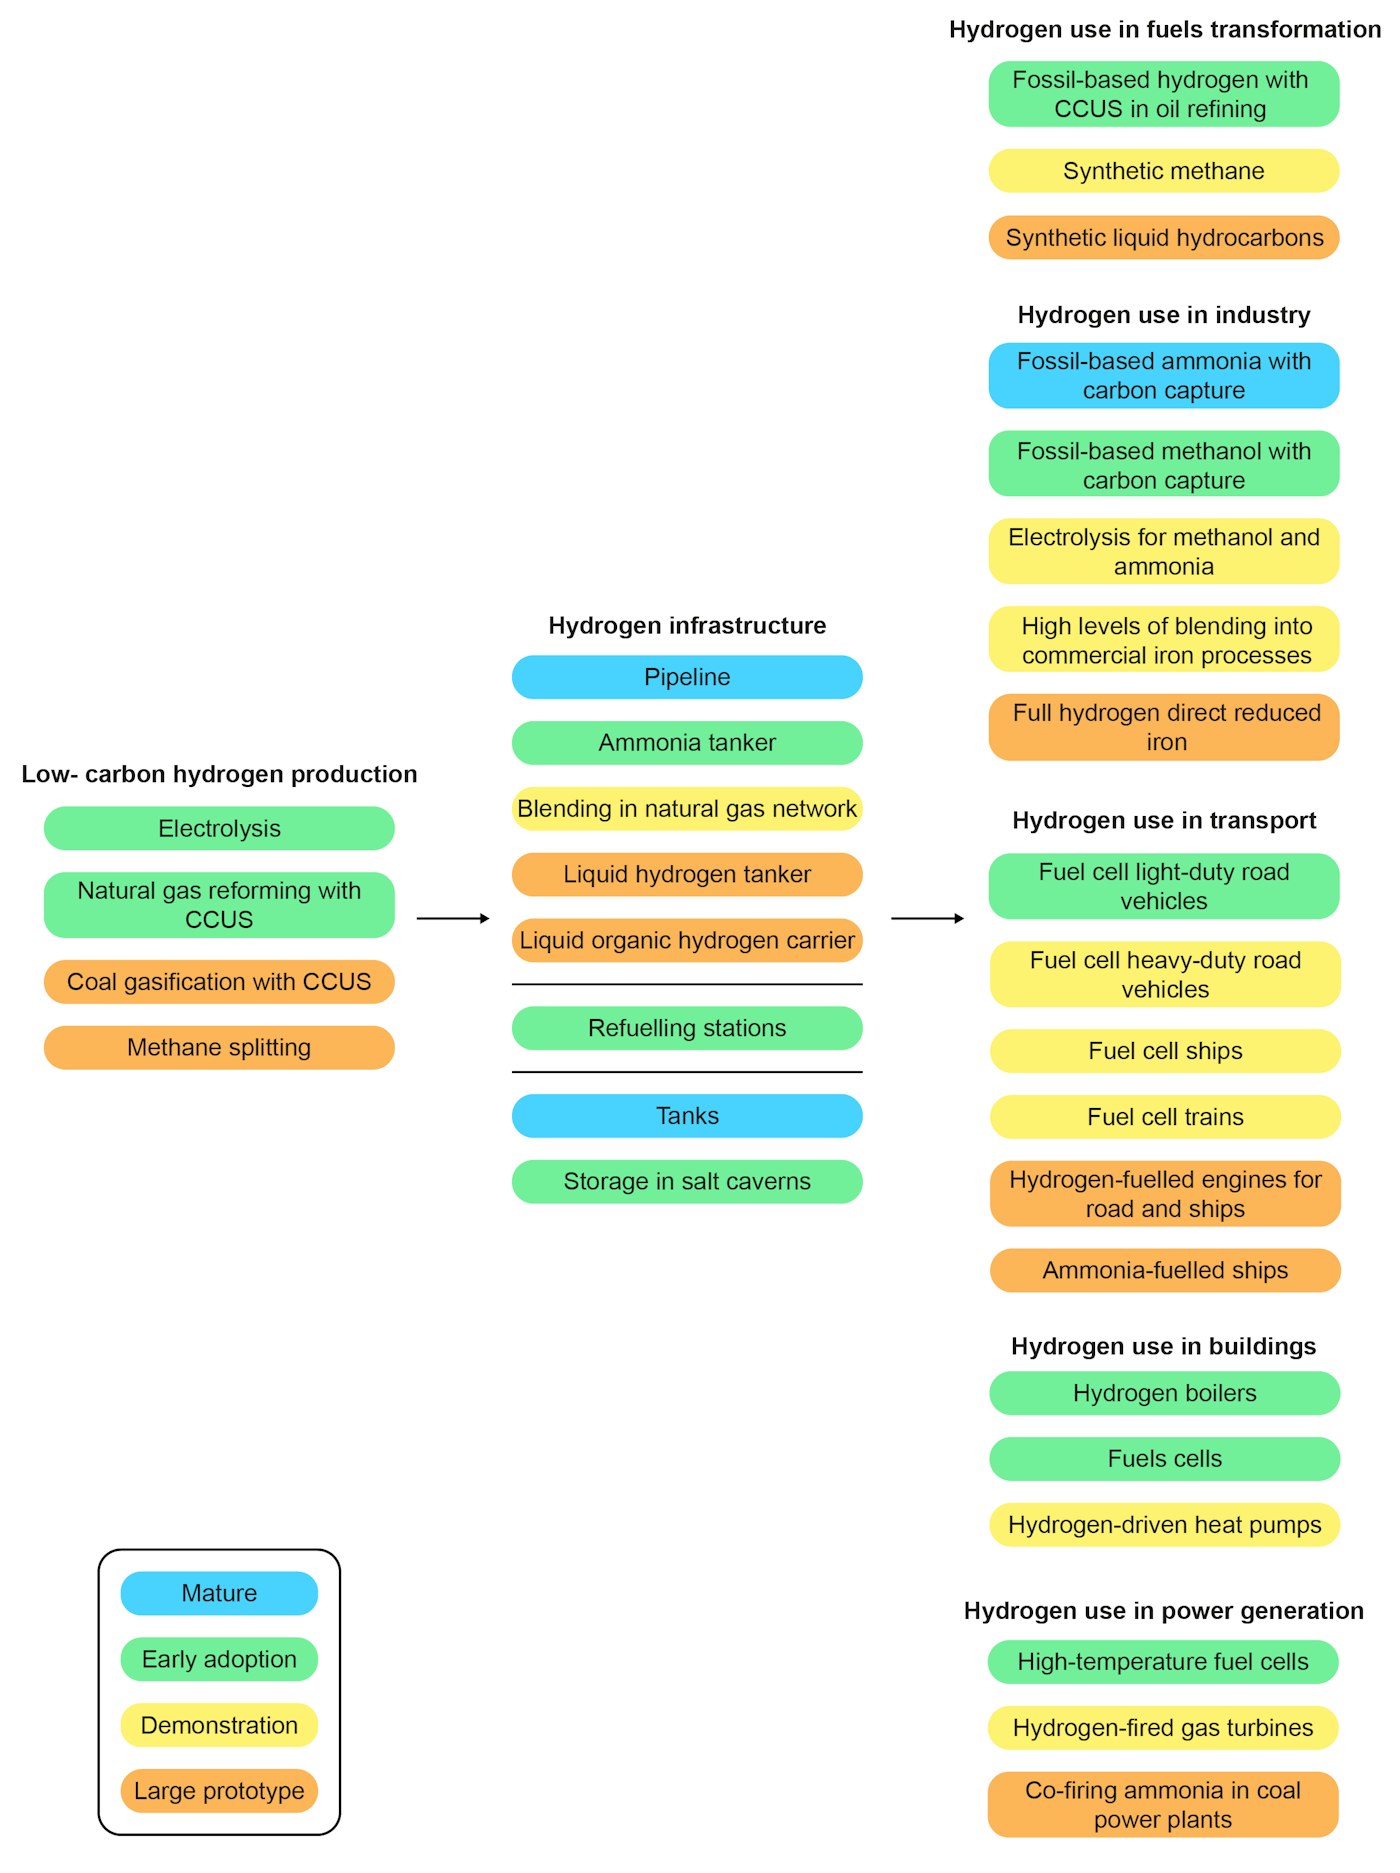
Timescales in taking technologies from the laboratory to market
History shows that it can take between 20 and almost 70 years for new energy technologies to go from first prototype to materiality (that is, to reach 1% of a national market) (Gross, 2018; Bento, Wilson and Anadon, 2018). Even recent success stories in clean energy technology development – such as solar photovoltaic (PV) and Li-ion batteries to power electric vehicles – took around 30 years years from their first prototype to the time of commercialisation. Having achieved market introduction, it took a further 25 years for solar PV to achieve a 1% share of a national electricity supply market for the first time (in Spain, closely followed by Germany), while it took just 6 years for Li-ion battery-powered electric vehicles to achieve the same national market share for the first time (in Norway). The time from prototype to market introduction for direct reduced iron technology was around 60 years – from prototypes in Sweden to the first commercial-scale MIDREX plant in South Carolina in the United States – due in part to the dominance of large blast furnaces over batch processes for a prolonged period.
Prototype to market introduction and early adoption periods for selected energy technologies
OpenAmong leading energy technologies, LED lighting for buildings achieved materiality in the shortest amount of time, being introduced in the United Kingdom just 10 years after the initial prototype was developed, while nuclear power was introduced in France just 18 years after the initial prototype. In both cases, government intervention accelerated innovation. While white LED lights were largely the product of private sector research funding, building on knowledge from the semiconductor industry, their early adoption was very heavily dependent on government standards and regulations for lighting efficiency. The large-scale deployment of nuclear power was driven by a combination of government-funded basic science and applied R&D in several countries and public procurement of the first large-scale plants in France.
Technology diffusion across borders
While Germany took about 20 years to meet 1% of national electricity demand from solar PV in 2008, Philippines, for instance, took only around 10 years to reach the same milestone in 2015. In the case of Li-ion batteries for light-duty electric vehicles, it took just 6 years in Norway to reach the milestone of 1% of the national market for light-duty electric vehicles, building on nearly two decades of effort to deploy EVs with other battery chemistries and the 12 years it took for electric vehicles to reach 1% market share in the United States.8
Years to materiality for solar PV and EVs powered by Li-ion batteries by country, 1980-2020
OpenThese trends illustrate both the lower costs encountered by later adopters and the institutional and societal learning that takes place between countries, their governments and companies. However, this should not be seen as an argument for governments to play wait-and-see and try to take advantage of the efforts of others. Early adoption can bring benefits in terms of market leadership. Companies in Germany and Japan became market leaders in producing solar PV panels and Li-ion batteries respectively, for example, and in selling expertise in developing supply chains.
The international deployment pattern is an argument in favour of maximising knowledge exchange between countries to accelerate deployment, learning-by-doing and economies of scale. While level playing fields are central to fair global trade, globally integrated markets favour innovation. In the Sustainable Development Scenario, cost reductions generated from experience in one market are assumed to be transferred to the next market to adopt the technology, so that the technology enters each successive market better able to compete against incumbent technologies and their corporate backers.
The assumptions in the Sustainable Development Scenario about the time periods for emerging technologies to reach commercial readiness take account of historical trends and the underlying factors behind them. The time for each technology type to develop from early prototype to first-of-a-kind commercial installation is particularly crucial: this can be a decade or more, even with strong policy support. In practice, industrial dynamics, investment and technical learning place limits on how fast some technologies – especially large unit size technologies – can reach the market.
In general, the Sustainable Development Scenario assumes somewhat shorter development periods than those observed in the past, since policy support is assumed to be much stronger, and to lead to more efficient exchange of technical knowledge and greater exploitation of synergies between sectors. Factors that have in the past led to discontinuous learning, including a lack of financial resources, fossil fuel price risk and political instability, are assumed not to affect innovation in the future.
Times to materiality for selected technologies in the Sustainable Development Scenario
OpenFor large, non-modular, site-tailored technologies still at a pilot stage today, a six to eight year period from first large prototype to full-scale demonstration is assumed in the Sustainable Development Scenario, followed by a seven to ten year period to first commercial introduction under prevailing market conditions. In some cases, up to five full-scale major demonstration projects operating for five to ten years in commercial environments around the world may be required to generate investor and regulator confidence, with knowledge transferred between them. On the other hand, small and/or modular technologies like engines, batteries and electrolysers are assumed to reach markets no later than 12‑14 years from early prototype in the Sustainable Development Scenario9. As a result, the various technology designs that become increasingly competitive and are adopted in the Sustainable Development Scenario enter early adoption at different times. These timescales apply to the first country adopting a technology; the timeframe is generally much shorter for other countries.
Moving down the learning curve
When learning-by-researching, learning-by-doing, standardisation, collaboration across the industry and economies of scale collectively result in cost and price reductions that continue over a decade or more, empirical “learning curves” (or experience curves) can be constructed to inform future expectations for similar technologies. The typical approach is to correlate the percentage cost reduction with the time it takes to double the cumulative installed capacity, which is a proxy for the level of experience and scale acquired by the industry.
Solar PV and Li-ion batteries are good examples of such learning curves. Each time the cumulative amount of capacity has doubled worldwide, unit costs for PV have fallen since the 1970s by 24%: in recent years, the fall in unit costs associated with each doubling of capacity (the learning rate) has increased to more than 30%. The equivalent learning rate for Li-on has been around 20%. For both technologies, these learning rates have led to an exponential decline in prices. Future cost declines are expected as capacity expands further, novel technology configurations are likely to be needed for such a decline to continue.
Both technologies built on many decades of relevant scientific and engineering R&D, and neither technology was developed to serve the energy sector. The first PV panel was demonstrated in 1954 and the first Li-ion battery was prototyped in 1979. The first application of solar panels was to power satellites and their first commercial applications were in wristwatches and pocket calculators.10 Li-ion batteries were first used in handheld video cameras and then smartphones. The military were early users of both technologies: early individual users tended to be wealthy individuals willing to pay for the unique attributes of the panels or devices. Subsequent niche markets for PV included light meters, flashlights, electric fences, off-grid holiday homes and lighthouses. For Li-ion they included medical implants, portable music players, mobile telephones, laptop computers, power tools and aviation applications. During the first decades of manufacturing, it was not clear in either case which configuration would become dominant: many changes were made by different researchers and firms to the types of
silicon wafers, electronics and electrodes that were used. Grid-connected electricity generation only became the primary market for PV in the 1990s, and electric vehicles only became the primary market for Li-ion in 2015.
Evolution of solar PV module cost by data source, 1970-2020
OpenEvolution of Li-ion battery price, 1995-2019
OpenThe learning rates for these two technologies are applied as appropriate in the Sustainable Development Scenario to other small, simple, modular and adaptable designs. For example, electrolysers and fuel cells, which have been manufactured in only limited volumes to date, see rapid adoption in the next decade that drives down costs and spurs mainstream diffusion. In some cases, the learning rates applied are lower, reflecting a more mature stage of development of a given technology. For example, heat pumps, for which significant learning experience has already been gained, follow a slower cost-reduction trajectory.
It is clear that not all technologies will follow the same journey, and learning rates in the Sustainable Development Scenario are adjusted in line with those seen for analogous technology scales and manufacturing methods. For example, energy technologies like refineries and turbines, which benefit from strong economies of scale in materials and throughput as well as in manufacturing, tend to experience periods of very rapid increases in unit scale and associated discontinuous patterns of cost reduction (Wilson, 2009). Occasionally the journey even involves going backwards: nuclear fission, a complex, large-scale technology, actually experienced “negative learning” in the 1970s and 1990s in France, partly due to the difficulties of standardising supply chains for successive projects (Grubler, 2010).
Unit cost reductions for selected technologies in the Sustainable Development Scenario, 2020-2070
OpenTechnology attributes for faster innovation
Understanding the innovation dynamics of different technology designs is vitally important for governments and investors alike. Various types of technology have attributes that benefit from different means of innovation support and attributes that can favour (or disfavour) rapid innovation cycles (Bennett, 2019). Knowing how these attributes affect innovation can help governments determine whether they should take a leading role at any given stage of the innovation value chain or whether the private sector might reasonably be expected to take on much of the innovation risk.
There are a number of attributes that influence the rates of learning and technology adoption in the Sustainable Development Scenario. They include small unit size and modularity – both of which favoured mass production, standardisation and continuous learning for PV and Li‑ion, as described above – as well as spillovers. One of them, the use of digital solutions, has the potential to reduce significantly the time it takes to bring a technology to market for a wide variety of energy technologies types that are not digital in nature. These attributes can give a better chance of success, but do not guarantee it: the history of energy is littered with examples of failed or stalled technological developments. In some cases, resources were allocated to solve a problem, such as perceived oil shortages, that did not persist and so the business case for the R&D strategy unravelled as a result (Grubbler and Wilson, 2014).
Energy technology attributes that can favour more rapid innovation cycles or faster learning
| Attributes | Description | Past examples | Examples in the Sustainable Development Scenario |
|---|---|---|---|
|
|
|
|
|
|
|
|
|
|
|
|
|
|
|
|
|
|
|
|
|
|
|
|
|
|
|
|
|
|
|
|
Note: CCUS = carbon capture utilisation and storage; O&M = operation and maintenance
Focus on spillovers as an important attribute for faster innovation
The history of energy technology development is rich with examples of spillovers that changed the course of investment and industrial competition. Knowledge accumulated in one technology area has been a powerful driver for innovation in other related technologies. This factor, often overlooked, is of vital importance to technology policy because the benefits of spillovers can be harnessed at relatively low cost and can avoid or reduce the need for additional R&D. In the Sustainable Development Scenario, spillovers play a significant role in the transition towards net‑zero emissions.
Spillovers can refer to knowledge transferring across technology areas (knowledge spillovers) or knowledge obtained by implementing a technology across different applications (application spillovers), though the boundaries between the two are sometimes blurred. Knowledge spillovers across different domains can occur if two technology designs share a common scientific base, similar manufacturing techniques, or common installation and operation skills. Application spillovers can occur when a technology design or technology component (such as an input material) that is optimised for one application becomes suitable for a different purpose. They are more likely to occur if the technology can be adapted to a large number of uses. The most potent cases of application spillovers have been termed “general-purpose technologies”. These technologies can drive productivity growth right across the economy if they bring radical efficiency gains in multiple sectors. Archetypal examples include steam engines, electric power and information technology (Bresnahan and Trajtenberg, 1995; Ruttan, 2008). Public investment in the science underpinning these types of technologies can have particularly large paybacks.
The knowledge transferred via spillovers can be transmitted through researchers, engineers, consultants and plant operators. Geographical proximity can enhance spillovers, as can professional societies and conferences. An important part is played by companies that provide services to different sectors, such as engineering, procurement, and construction contractors and technical consultancies (Hoppmann, 2018).
Many critical spillovers that have benefited specific energy technologies have come from outside the energy sector. The development of combined cycle gas turbines, which now play an integral role in electricity generation systems, was initiated by the aerospace sector. The first gas turbine jet engine was developed in 1939 following government-funded military R&D in the United Kingdom. These gas turbines were initially rejected by electricity utilities for being low powered and inefficient compared with steam turbines, but a number of blackouts in industrialised countries in the 1960s led utilities to install gas turbines designed for aircrafts for emergency backup. In response to power sector requirements, gas turbine power output and efficiency were increased (Watson, 2001). Additional demand then led to further improvements in materials and design.
Another example is provided by the cost-competitive mass production of solar PV panels, which was enabled by knowledge spillovers from parallel developments in the production of silicon for microprocessors. Adoption of semiconductor manufacturing processes by the PV sector and sharing of silicon production between the two sectors were vital factors in cutting PV costs, resulting in the share of PV in total polysilicon demand growing very rapidly after 2000, by which time polysilicon prices had fallen to less than 10% of their 1975 level. Likewise, the development of the carbon anode used in Li-ion batteries benefited from knowledge and techniques developed by the petrochemical sector: the first functioning carbon anode was developed by a petrochemical company.
Share of PV in polysilicon demand (left) and polysilicon price (right), 1975-2010
OpenCould biofuel technology developments benefit through spillovers from the race for a Covid-19 vaccine?
R&D in biotechnology is attracting increased interest as the race continues to produce an effective Covid-19 vaccine. Applying biotechnology in the form of genetic engineering11 to certain plants and microalgae could help scale-up the production of any vaccine when it becomes available, while also potentially creating synergies with the production of biofuels.
Typically, vaccines are produced within bacterial or mammalian cells. Developing these cell lines can take months, and scaling them up in a stable way can take at least a year or two. Growing and harvesting genetically modified plants and microalgae, on the other hand, takes only a matter of weeks, and no additional scale-up protocol is required, allowing full production to be ready in months. This could deliver vaccines faster while reducing production costs and potentially also avoiding the need for expensive refrigeration of the vaccine (Balfour, 2020; Capell et al., 2020).
Development of genetically engineered plants (also known as transgenic plants) for the production of vaccines is not a new concept, but has yet to be commercialised. There are, however, several plant-based vaccines now undergoing clinical trials, such as ZMapp, a combination of antibodies produced in transgenic tobacco plants that was used to fight the Ebola virus in 2015 (Xu, Towler and Weathers, 2016). Several companies and research institutes are actively pursuing both genetically engineering plants and microalgae to develop a suite of tools to control the Covid-19 pandemic, including proteins for vaccines, antivirals and testing kits (ISAAA, 2020).
There are two key techniques in the biotechnology domain that, if further developed and commercialised, could help overcome barriers to the commercialisation of advanced biofuels production:
- Genetic engineering could increase the content of biomass materials that can be used as feedstocks for energy purposes (e.g. sugars, oil and lignocellulosic material in plants) or produce enzymes that break down lignocellulosic material, thus facilitating its further processing to produce biofuel.
- Advanced extraction techniques could allow multiple bioproducts (e.g. oil, proteins, sugars) to be recovered efficiently at high purity, lower energy requirement and low cost (Kumar et al., 2020; CRAG, 2020a).
Biorefineries provide an ideal platform to exploit potential synergies because they are able to create multiple products from a single biomass feedstock in much the same way as petroleum refineries produce multiple products from crude oil. This offers the prospect of diversified revenue streams that reduce the production cost of each individual bioproduct (whether for pharmaceuticals, nutrition, biofuels) and help to insulate the producer from the economic impacts of market fluctuations within different sectors. Depending on the feedstock selected, two approaches that hold promise are:
- Genetic modification of microalgae to produce increased oil, sugar, proteins or other compounds that can be extracted and then refined for use in myriad of sectors, including biofuels and pharmaceuticals
- Use of transgenic plants (e.g. tobacco) and residual biomass (biomass that remains after extracting the proteins or enzymes of interest for medical purposes) to produce bioethanol or biogas.
Governments, research institutions and companies can stimulate this spillover effect by harnessing transgenic plants and microalgae research for both pharmaceutical and biofuels applications. The Centre for Research in Agricultural Genomics in Spain is an example of how this might be approached: it is pursuing research to find a vaccine for Covid-19 alongside research on how best to use lignocellulosic material to produce bioethanol (CRAG, 2020a; 2020b).
Spillovers in the Sustainable Development Scenario
Spillovers play a particularly important role in the Sustainable Development Scenario. This section discusses how spillovers accelerate progress in four selected technology areas: electrochemistry, carbon capture in low CO2 concentration applications, composite materials for lightweighting, and vapour compression cycles for cooling and heating. These four technologies together account for 30% of the additional cumulative emissions reductions through to 2070 in the Sustainable Development Scenario compared with the Stated Policies Scenario, with electrochemistry accounting for around 45% of these reductions.
Emissions reductions between the Sustainable Development Scenario and the Stated Policies Scenario enabled through selected technology synergic areas
OpenQuantifying the impact of spillovers on accelerating technology cost reductions
There is no consensus today on how to quantify the impact of spillover effects. The impact of knowledge spillovers cannot be easily quantified because of the complexity of the interactions between those working on different technologies that use the same scientific principles. The impact of application spillovers in technology cost can, however, be quantified by making use of learning curves. As discussed earlier in this chapter, learning curves relate the cost reductions for a given technology to its cumulative installed capacity, which is a proxy for the level of experience and scale acquired by the industry. We develop learning curves that aggregate the projected cumulative installed capacity resulting from implementing that technology in different applications, so that the projections reflect the accumulation of learning from multiple sources. Then we develop alternative learning curves based only on the deployment in each individual application, and we use that as a counterfactual to isolate the effect of spillover in cost reductions in the Sustainable Development Scenario.
Electrochemistry: Spillovers between batteries, fuel cells and electrolysers
Electrochemical devices convert electrical energy into chemical energy (and vice versa). Because chemical energy is easier to store in large quantities than electrical energy, these devices have an important role to play in the electrification of transport and the provision of short- and long-term storage (through hydrogen synthesis) for variable renewables. Batteries, fuel cells and water electrolysers are all electrochemical devices, and together they are responsible for 15% of the projected cumulative emissions reductions to 2070 in the Sustainable Development Scenario compared to the Stated Policies Scenario These technologies share scientific principles, component design, and materials and manufacturing techniques, which means that developments in one kind of device are likely to directly or indirectly benefit advances in others. These synergies are most likely to be exploited by organisations involved in the development of more than one of these technologies. Examples include automotive companies developing fuel cell and battery-electric vehicles in parallel, manufacturers using decades of knowledge about chlorine electrolysis for alkaline water electrolysers, and chemical companies developing components for batteries, fuel cells and electrolysers.
A way to illustrate the potential of strengthening such spillovers across these three electrochemical devices is to explore the cost-reduction potential of specific common component families: electrodes, membranes and electrolytes, cell and stack assembly, and balance of plant components. Analysis suggests that advanced materials and manufacturing techniques for electrodes (i.e. cathodes and anodes) could unlock between around 20% and 45% of the cost-reduction potential for polymer electrolyte membrane (PEM) electrolysers, fuel cells and Li-ion batteries in the Sustainable Development Scenario, while sharing learning on improving the balance of plant between PEM electrolysers and fuel cells could deliver 45% and 25% cost reductions in these two technologies respectively.
Breakdown of cost-reduction potential for electrochemical devices by component category
OpenIn the Sustainable Development Scenario, the deployment of batteries in electric vehicles and in grid storage applications brings spillover benefits. Fuel cells and electrolysers benefit more from learnings in batteries development and manufacturing than the other way around because they have less advanced value chains and there is less experience of mass manufacturing them in large numbers: this helps to accelerate the deployment of fuel cells and electrolysers, which become more competitive against alternatives as a result of their spillover gains.
The Sustainable Development Scenario also sees spillover benefits from deploying the same electrochemical device across different applications. For example, synergies between batteries developed for the automotive sectors and those for grid-scale applications lead to lower cost batteries for grid storage. Grid storage costs in the Sustainable Development Scenario would be 20% higher by 2070 without these spillover gains.
Composite materials: Spillovers between lightweight wind turbines, road vehicles and aircraft
The increased use of light materials such as carbon fibre-reinforced plastics (CFRP) offers scope for fuel savings in road vehicles and aircraft, and for higher capacity factors in wind turbines. Today, the use of CFRP in these three areas is still at a relatively early stage. In road vehicles, it is estimated to account for less than 1% of the average vehicle weight in most cases. In aircraft, by contrast, composite plastic use is relatively common, although not yet ubiquitous: CFRP makes up on average about 10% of structural weight in small and medium aircraft, and about 25% in larger aircraft: nearly fully CFRP designs are in the demonstration phase (Air Transportation Analytics Ltd. And Ellondee Ltd., 2018; NASA, 2010; Coppinger, 2019). In wind power applications, roughly 25% of turbines are manufactured with carbon fibre components in their blades (Composites, World, 2020).
These applications are all linked through a common material (carbon fibre) and a common manufacturing base, which means that there is scope for accelerated innovation through spillovers as the use of carbon fibre-reinforced plastic increases. In particular, use of carbon fibre in the road transport fleet provides scope for spillover gains for the relatively smaller sectors of wind energy and aviation.
In aviation-related applications, spillover effects result in a 20% reduction in the cost of CFRP in 2070 in the Sustainable Development Scenario relative to a case without spillover: this cost reduction leads to greater use of CFRP in aircraft, which reduces fuel costs and speeds up performance improvements.
In wind turbines, composite plastic materials bring a number of improvements, mainly by making larger turbine diameters available earlier. Turbines with larger swept areas provide higher and more reliable electricity output: steadier output is easier to integrate and increases the value of wind power in electricity markets. Higher capacity factor wind turbines also open up low-wind areas for wind farm development that would have otherwise been considered unattractive, thus increasing the exploitable wind resource.
The combined spillovers from these wide-ranging applications also trigger innovation activity along the whole CFRP supply chain, resulting in cost, energy and emission reductions through multiple avenues both in carbon fibre production – including using alternative precursors, recycled fibres and alternative production processes – and in the conversion of carbon fibre into CFRP – including though rapid cure and automated processes that speed production. The supply chain innovations impacting the CO2 intensity of CFRP production alone enable 1.5 MtCO2 additional emissions savings in 2070 from the integration of CFRP compared to a hypothetical case in which each application was developed in isolation.
At present, it is challenging to recycle CFRP, since many current recycling technologies damage the carbon fibres, making them unsuitable for many applications and so reducing their value. Current recycling options also tend to be expensive or require toxic chemicals. Further innovation is needed so that this lack of recyclability can be overcome: this would promote greater use of CFRP, and would also reduce energy consumption by cutting down on the need for virgin CFRP production. Several methods are currently under exploration, including one that uses non-toxic solvents and another that melts the polymers into a new CFRP.
Carbon capture: Spillovers between low CO2 concentration applications
By 2070, the use of CCUS is responsible for more than 10% of the additional cumulative emissions reductions in the Sustainable Development Scenario compared with the Stated Policies Scenario. Achieving the deployment levels necessary to achieve this requires developing and scaling-up a suite of different CO2 capture technologies that can be adapted to different CO2 sources. CO2 separation techniques range from chemical absorption and membrane separation (already used by industry for other gases) to those that require more disruptive innovations, such as oxy-fuel and calcium looping.
Chemical absorption is the most advanced carbon capture technique. It was developed in the 1930s and has been applied commercially over several decades to separate out CO2 from gases with a wide range of CO2 concentrations. Cumulative installed capture capacity is estimated today at around 860 MtCO2/year.
Despite accumulated experience to date, there is scope for further cost reductions from sharing the knowledge gained about the use of chemical absorption in different processes. There is also scope to reduce capital costs, for example through the standardisation of capture units, economies of scale and learning-by-doing from large-scale deployment. In the Sustainable Development Scenario, the learning gained from industrial applications of chemical absorption in industry and power generation mean that the cost of deploying this technology is around 10% cheaper in the Sustainable Development Scenario by 2070 than in a hypothetical case where there is no learning from other applications of this technology.
Cumulative capacity and capital cost learning curve for chemical absorption in industrial and power applications in the Sustainable Development Scenario, 2019-2070
OpenPotential knowledge spillovers from electrochemistry to carbon capture
Typically, carbon capture techniques rely on changes in temperature or pressure in order to absorb and release CO2 captured from gas streams. However, novel devices are now making use of electrochemical reactions to trap and liberate CO2. These reactions have the potential to capture CO2 even when its concentration is as low as 0.04%, i.e. the proportion of CO2 in air.
One such device, called electro-swing adsorption (ESA), is similar to a large battery. It adsorbs CO2 if a CO2-containing gas passes across the electrodes at the same time as electricity charges it. The discharge cycle releases pure CO2. ESA has been demonstrated at laboratory scale using quinone sorbents in solution and has recently been adapted by tethering the solvents to a solid surface. Researchers are currently planning a prototype device.
As this design is compact, modular and relies solely on electricity, it would have the flexibility to operate with variable electricity supplies. Furthermore, with an electricity requirement of up to 2.5 GJ per tonne CO2 captured, it is expected to need around four times less energy than solid sorbent-based DAC, which currently needs around 7 GJ of low-temperature thermal energy and 1-2 GJ of electricity. However, before ESA can become a competitive alternative, it will need to increase the sorption time in order to minimise the number of cells required, and this will involve capital costs (Wilcox, 2020). Fewer cells will also help to manage the land area required: it has been estimated that a 1 MtCO2/yr ESA DAC plant would require tens of thousands of square metres for the capture equipment alone. This is lower than the estimates for solid-sorbent DAC designs, but still represents a significant challenge to deployment.
Another way in which electrochemical processes can be harnessed for carbon capture is through carbonate fuel cells. These cells generate electricity from carbon-containing inputs, such as natural gas, while converting all the carbon to a stream of CO2 and hydrogen by-product: CO2 can then be easily separated from other flue gases. If the flue gas containing CO2 is fed into the fuel cell, then the fuel cell separates both the CO2 from the electricity generation process and the CO2 from the flue gas input and allows them to be captured together. Molten carbonate fuel cells have been tested since the 1960s and have operated in commercial conditions since the early 1990s: over 300 MW of capacity has been installed to date (Weidner, Ortiz Cebolla and Davies, 2019).
All electrochemical approaches to CO2 capture will continue to benefit from knowledge spillovers from more mature electrochemical devices, like batteries, including their experience in mass production and electrochemical plate design.
Efficient heating and cooling: Spillovers between air conditioners and heat pumps
Heat pumps and efficient air conditioners are a cornerstone of buildings sector decarbonisation, enabling almost a quarter of the cumulative additional CO2 emissions reductions through to 2070 in the Sustainable Development Scenario compared to the Stated Policies Scenario. Both devices are generally based on the vapour compression cycle, which transfers heat energy from one source to another (air-to-air, air-to-water, water-to-water) to provide end-use services (space cooling, space heating, water heating). Air conditioners are optimised cooling applications, whereas heat pumps are optimised heating applications. When reversible, a vapour compression cycle provides both heating and cooling comfort. While learning has been accumulated for decades from designing, manufacturing and installing these devices, spillovers between these two applications still have the potential to stimulate further innovation and to speed up incremental cost reductions and efficiency improvements.
Historically, the development of heat pumps and air conditioners has been driven by a combination of reducing upfront costs, improving reliability and increasing efficiency of thermal energy delivered or removed per unit of electricity consumed. For air conditioners, efficiency has improved thanks to a combination of market forces and regulations (e.g. minimum energy performance standards for products and buildings codes), while costs have continuously decreased, so that more efficient products such as inverter air conditioners have increasingly replaced less efficient products (Groff, 2014; Desroches, L. B. et al., 2013). Performance improvement and cost reduction have, however, slowed down in recent years. Heat pump performance and cost metrics have also improved, mainly as a result of policy incentives, while growing demand for heat pumps has opened the way for innovative market schemes in which, for instance, operators of distribution systems act as service providers and/or heat pump operators.
Globally, the growth of cooling needs is the main demand-pull mechanism for current and future improvements in vapour compression technologies. Current global space cooling installed capacity is more than 10 times larger than that of heat pumps. In the Sustainable Development Scenario, despite rapid heat pump growth, space cooling installed capacity remains almost four times larger than that of heat pumps for primary heating use in 2070. Synergies between air conditioners and heat pumps mean that heat pumps achieve an additional 15% cost reduction thanks to spillovers from cooling applications in 2070 in the Sustainable Development Scenario.
These improvements in cost and performance would result in heat pumps gaining half of the heating market share globally, mainly in countries like the Russian Federation and the People’s Republic of China (hereafter “China”), where the incumbent heating technology is direct or district use of natural gas or coal. They are likely to require a special focus on balance-of-system components and soft costs, which are expected to account for a growing share of total future costs. In the longer term, they are also likely to require alternative designs to reduce what are currently considered the minimum costs which are technically achievable: this might involve the use of innovations such as vapour compression cycles based on optimised low global warming potential refrigerants.
Cumulative capacity and capital cost learning curve for vapour compression applications in the Sustainable Development Scenario, 2019-2070
OpenReferences
In this report, unless otherwise stated, historical and projected CO2 emissions from the energy sector include those from fossil fuel combustion as well as from industrial processes, which are often closely linked to energy use.
For further details see IEA (2019).
This scenario serves as a benchmark for the projections of the Sustainable Development Scenario. It assesses the evolution of the global energy system on the assumption that government policies that have already been adopted or announced with respect to energy and the environment, including commitments made in the nationally determined contributions under the Paris Agreement, are implemented.
This scenario serves as a benchmark for the projections of the Sustainable Development Scenario. It assesses the evolution of the global energy system on the assumption that government policies that have already been adopted or announced with respect to energy and the environment, including commitments made in the nationally determined contributions under the Paris Agreement, are implemented.
Even if released again, the use of fossil CO2 can contribute to CO2 reduction as, in principle, each carbon molecule is being used twice: the carbon contained in a fossil fuel is used to produce energy or in an industrial production process; then the resulting CO2 is used in combination with hydrogen to produce a synthetic hydrocarbon fuel.
A bioethanol plant in Illinois (United States) captures and stores 1 Mt of CO2 per year.
Stationary fuel cells deployed today mostly rely on natural gas as fuel, although they are capable of using hydrogen.
Plug-in hybrid electric vehicles and battery-electric vehicles combined.
This consideration applies only to the projected period, and excludes instances in which technologies may have taken already a longer period from first prototype to reach current status of development prior to 2020.
The small solar cells used in consumer products in the late 1970s initially had near-zero costs for electronics companies as the market could be satisfied from unusable offcuts from larger modules produced for unprofitable offgrid applications.
In this form, genetic engineering involves manipulating the metabolic pathways within organisms to produce desired bioproducts so that plants and microalgae become a type of plant factory.
Reference 1
In this report, unless otherwise stated, historical and projected CO2 emissions from the energy sector include those from fossil fuel combustion as well as from industrial processes, which are often closely linked to energy use.
Reference 2
For further details see IEA (2019).
Reference 3
This scenario serves as a benchmark for the projections of the Sustainable Development Scenario. It assesses the evolution of the global energy system on the assumption that government policies that have already been adopted or announced with respect to energy and the environment, including commitments made in the nationally determined contributions under the Paris Agreement, are implemented.
Reference 4
This scenario serves as a benchmark for the projections of the Sustainable Development Scenario. It assesses the evolution of the global energy system on the assumption that government policies that have already been adopted or announced with respect to energy and the environment, including commitments made in the nationally determined contributions under the Paris Agreement, are implemented.
Reference 5
Even if released again, the use of fossil CO2 can contribute to CO2 reduction as, in principle, each carbon molecule is being used twice: the carbon contained in a fossil fuel is used to produce energy or in an industrial production process; then the resulting CO2 is used in combination with hydrogen to produce a synthetic hydrocarbon fuel.
Reference 6
A bioethanol plant in Illinois (United States) captures and stores 1 Mt of CO2 per year.
Reference 7
Stationary fuel cells deployed today mostly rely on natural gas as fuel, although they are capable of using hydrogen.
Reference 8
Plug-in hybrid electric vehicles and battery-electric vehicles combined.
Reference 9
This consideration applies only to the projected period, and excludes instances in which technologies may have taken already a longer period from first prototype to reach current status of development prior to 2020.
Reference 10
The small solar cells used in consumer products in the late 1970s initially had near-zero costs for electronics companies as the market could be satisfied from unusable offcuts from larger modules produced for unprofitable offgrid applications.
Reference 11
In this form, genetic engineering involves manipulating the metabolic pathways within organisms to produce desired bioproducts so that plants and microalgae become a type of plant factory.