Driving Energy Efficiency in Heavy Industries
Global energy efficiency benchmarking in cement, iron & steel
Abstract
Global benchmarking of energy efficiency in the iron and steel sector and the cement sector indicates that many G20 countries have made strong progress. It also shows that countries could further improve efficiency considerably by optimising production processes and implementing best available technologies. Policy makers could use this benchmarking to identify major potential for improvement, set and track adequate targets, and promote the sharing of best practices internationally.
Benchmarking of processes – comparing their performance to best practices or standard indicators – is a powerful way of gauging whether they have improved. Improving the availability, scope and quality of country-level data on energy consumption in industrial sectors could enhance the value of global energy efficiency benchmarking as a tool for policy makers. International co‑operation will be key to collecting further data and progressively harmonising data collection across countries.
Governments can use a range of policy measures to scale up efficiency investments in key technologies and business solutions in the industry sector, including regulations, incentives and information. In combination, these measures can boost energy efficiency across the market when they promote installation of energy-efficient equipment, optimisation of production processes through better controls and maintenance, and retrofitting with more energy-efficient and less carbon-intensive technologies. Digitalisation can create new opportunities for policy makers to capture the untapped energy efficiency potential revealed by global benchmarking.
Implementing efficiency measures will help countries to unlock a range of benefits during a time of economic challenges. These benefits include creating jobs, enhancing industries’ competitiveness, triggering technological innovation, cutting energy bills, strengthening the security of energy supply, protecting the environment and reducing greenhouse gas emissions.
Global benchmarking helps policy makers identify ways to improve efficiency
The rate of global energy efficiency improvement has undergone a worrying slowdown over the last decade. The Covid‑19 crisis has exacerbated this slowdown by creating liquidity stress and pushing down energy prices, delaying investments in clean and efficient technologies. Global energy efficiency is expected to improve by only 0.8% in 2020, roughly half the rates for 2019 (1.6%) and 2018 (1.5%) and well below the rate of 3% needed to achieve global climate and energy goals.
The industry sector, including iron, steel, cement, chemicals and petrochemicals, accounts for over 30% of global total primary energy demand. In 2020, the Covid‑19 pandemic pushed down energy use significantly across all industrial sub-sectors. Output of less energy-intensive sub-sectors has declined more sharply than the output of the energy-intensive sub-sectors of iron and steel, and cement. This creates a structural effect on industrial energy intensity that is expected to increase in the next few years.
Energy efficiency has numerous benefits for our societies and economies. It increases industries’ competitiveness, boosts technological innovation, reduces energy bills, reinforces the security of energy supply, safeguards the environment and helps to limit climate change. Energy efficiency’s potential to create millions of jobs is particularly important as the world seeks to recover from the effects of Covid‑19 pandemic through economic stimulus. Energy efficiency is job intensive, relying heavily on the availability of skilled workforces and the supply of energy-efficient products and services. The recent IEA report Sustainable Recovery shows that 18 jobs could be created per USD 1 million invested in industrial efficiency, for example by upgrading key equipment such as motors, fans and pumps, introducing digital technologies to improve monitoring and controls, and installing waste recovery technologies.
The Global Commission for Urgent Action on Energy Efficiency, convened by the executive director of the IEA in response to the global slowdown in energy efficiency progress, has found that stronger policy action is needed to ensure rapid implementation of measures that boost energy efficiency. The commission’s recent recommendations also highlighted the importance of strengthening international collaboration and exchange, which will create important opportunities for countries to learn from one another and identify untapped potential for further efficiency gains.
The global benchmarking of industrial energy efficiency, which Japan embarked on when it held the G20 presidency in 2019, creates such opportunities for international exchange as it develops energy efficiency benchmarks for energy-intensive industry sectors. These benchmarks can help policy makers to:
- identify major potential for improvement
- set and track adequate targets
- promote the sharing of best practices internationally
- justify the need for new policies
- develop specific measures, including industry-wide and company-level energy efficiency targets.
Global benchmarking enables policy makers to assess the energy efficiency performance of their key industries in the wider international context. Levels of efficiency vary significantly from country to country. In the absence of benchmarking, no global baseline or common methodology would be readily available to help policy makers set or update efficiency targets.
The global benchmarking project begun by Japan indicates the efficiency gains that each country could achieve by applying to their industrial processes energy efficiency technologies that are readily available in the markets or best available technologies. Currently, the project focuses on heavy industries, in particular the iron and steel sub-sector and the cement sub-sector, given the significance of energy use for steel and cement production and the availability of comparable datasets.
The project calculates the current efficiency levels of targeted industry sub-sectors in G20 countries using a range of datasets (see annex) to determine the specific energy consumption (e.g. thermal or electricity) required to produce each tonne of crude steel, clinker or cement. The efficiency data of the best available technologies for key steps in each production process are pulled together from an extensive literature review and expert consultation. Then the levels of efficiency are calculated that each country could achieve if it applied all the best available technologies across production processes and intermediary steps. Thus the global benchmarking analysis not only enables a cross-country comparison of efficiency levels but also indicates opportunities for efficiency gains in each country, within the limits of available data and levels of detail (for data limitations, see Annex).
Since 2019 the project has gone through several steps:
- establishment of benchmarking methodology and modelling
- analysis of existing datasets
- identification of the best available technologies
- quantification of the energy efficiency potential of best available technologies.
Preliminary outcomes of the global benchmarking analysis were reported at the joint workshop hosted by the IEA in September 2019. The meeting highlighted emerging interests among key countries in the project as an effective means to understand the current levels of efficiency in the wider context and to identify opportunities for improving efficiency. Further benchmarking analysis by the IEA in close collaboration with Japan has led to several key findings about efficiency in the iron, steel and cement sub-sectors.
While many countries have made strong progress on energy efficiency, there is still considerable cost-effective potential for further gains
Iron and steel sub-sector
Demand for steel is estimated to have declined by 5% in 2020 relative to 2019. However, industry will return to a robust growth trajectory once the Covid‑19 pandemic is brought under control and economic activity resumes. Economic development, population growth and intensifying urbanisation will push up demand for goods and services. Global demand for steel is likely to grow by more than a third through to 2050. Among heavy industries, the iron and steel sub-sector accounts for the second-largest share of energy consumption and the largest source of emissions. Targeted early measures to improve energy efficiency and lock in higher efficiency in industrial assets are necessary to curb the sub-sector’s growing energy consumption and CO2 emissions.
Three process routes dominate steel manufacturing. The blast furnace-basic oxygen furnace process route, which uses iron ore and coke to produce steel, represents 90% of primary production. The direct reduced iron-electric arc furnace uses high-quality iron pellets and natural gas as the main heat source. The third main route, scrap-based electric-arc furnaces, are 60‑70% less energy-intensive than the other routes because they use recycled metal. While many G20 countries have made strong progress on energy efficiency in the iron and steel sub-sector, there is still considerable cost-effective potential for further gains, given the energy intensity obtainable using the best available technologies.
The global benchmarking project estimated the specific energy consumption involved in producing each tonne of crude steel in 2018, covering the consumption of thermal energy and electricity across all iron and steel manufacturing processes, including blast furnaces and coke ovens. The project also calculated the G20 average of energy intensity in the iron and steel sub-sector, as well as energy intensity for each G20 country, by taking into account the share of process routes and applying the best available technologies’ efficiency values to each of those processes. The distance between countries’ specific energy consumption and the energy intensity possible using best available technologies varies significantly from country to country, as shown in the figure below, indicating substantial potential for efficiency gains in many countries.
Final energy use and energy intensity possible using best available technologies, 2018
OpenAnother important finding is that some process routes present greater efficiency potential than others. Comparing the current levels of specific energy consumption with the share of the blast furnace-basic oxygen furnace route in G20 countries indicates that electrified process routes, such as direct reduced iron-electric arc furnaces and scrap-based electric arc furnaces, are more energy-efficient.
Energy intensity levels and share of the basic oxygen furnace route in total production of crude steel
OpenSteel plants are capital-intensive, long-lasting assets that typically operate over 40 years. That is why it is vital to ensure that best available technologies are used in all key production processes at the time of construction or during major upgrades. In new and existing production facilities and equipment, efficiency can be improved by:
- optimising processes through better controls and monitoring
- upgrading process equipment to commercially available best available technologies
- integrating artificial intelligence to enhance productivity
- recovering waste heat, for example by using coke dry quenching or top-pressure recovery turbines.
In addition, implementing energy management systems can ensure that best practices are in place at minor cost.
An energy saving of around 20% per tonne of crude steel would be possible globally if all blast furnace-basic oxygen furnace production facilities invested in readily available cost-effective technologies. Efficiency gains are also possible, along with reductions in greenhouse gas emissions, through fuel switching – from coal to less carbon-intensive alternatives, such as natural gas, bioenergy or even hydrogen – and electrification with increased use of scrap metals through more effective scrap collection.
New technologies that have yet to be commercialised will play an increasingly important role in meeting long-term ambitions for net-zero emissions and decarbonisation. They will pave the way for improving energy efficiency by switching to lower-carbon energy carriers, expanding the use of low-carbon hydrogen and deploying carbon capture, utilisation and storage.
Technology opportunities to achieve net-zero emissions in the cement sector
|
Technology |
Details |
Readiness |
Importance |
|---|---|---|---|
|
Blast furnace > CCUS > Conversion of steel plants’ waste gases to chemicals |
This technology “recycles” waste gases from steel plants (such as blast furnace gas and coke oven gas) into chemicals, thus using the CO2 twice and delaying its release. |
7 |
Moderate |
|
Blast furnace > CCUS > Conversion of steel plants’ waste gases to fuel |
This technology “recycles” waste gases from steel plants (ex. blast furnace gas and coke oven gas) into synethic fuels, thus using the CO2 twice and delaying its release. |
8 |
Moderate |
|
Blast furnace > Electrolytic hydrogen partially replacing injected coal |
Hydrogen can replace a portion of injected coal, thus reducing the need for coal. |
7 |
Moderate |
|
Blast furnace > Process gas hydrogen enrichment and CO2 removal for use or storage > CCUS > Chemical absorption |
Process gas hydrogen enrichment and CO2 removal are options, used alone or in combination, to reduce emissions from blast furnaces. Hydrogen enrichment involves capturing process gases and recirculating them after reheating (to 900°C) into the blast furnace as a reducing agent to lower requirements for coke and other fuels. The recirculated gas can be any CO and H2 source, with CO and H2 from coke oven gas and basic oxygen furnace gas the easiest to recover. Additionally, CO2 from blast furnace gas can be recovered and reformed into CO and H2, for use in the blast furnace or for external uses. Surplus CO2 can be transported for storage, further reducing emissions. |
5 |
Very high |
|
Blast furnace > Torrefied biomass partially replacing injected coal |
Biomass can be converted into a coal-like material through torrefaction, in which biomass is heated to 200-400°C in the absence of oxygen. The resulting “bio-coal” is more similar to coal than to the original biomass. Bio-coal can be used in blast furnaces to replace a portion of injected coal. |
7 |
Moderate |
|
Direct reduced iron > Based on 100% electrolytic hydrogen |
The 100% electrolytic hydrogen direct reduced iron route involves direct reduction of iron ore – reducing iron ore to iron without melting – using electrolytic hydrogen gas rather than natural gas or coal. |
5 |
Very high |
|
Direct reduced iron > Based on natural gas with high levels of electrolytic hydrogen blending |
Direct reduced iron plants typically use natural gas or coal. Emissions from the process are strongly reduced by substituting a portion of the natural gas or coal with hydrogen, produced by electrolysis of water using fossil-free electricity. The current commercial technology is already suited to work with up to 30% natural gas displacement by hydrogen, without significant changes, but higher blends are also under exploration. |
7 |
High |
|
Direct reduced iron > CCUS > Chemical absorption |
Direct reduced iron plants could be equipped with chemical absorption-based CO2 capture, a common process operation based on the reaction between CO2 and a chemical solvent (e.g. amine-based solvents). The CO2 is released at around 120°C to 150°C and the solvent regenerated for further operation. |
9 |
Very high |
|
Direct reduced iron > CCUS > Physical adsorption |
Direct reduced iron plants could be equipped with physical adsorption-based CO2 capture, in which molecules are captured on the surface of selective materials called adsorbents. Desorption of the CO2 (release from the surface) may be achieved using pressure swing adsorption (PSA), performed at high pressure, or vacuum swing adsorption (VSA), which operates at ambient pressure. A hybrid configuration also exists Vacuum Pressure Swing Adsorption (VPSA). |
5 |
Very high |
|
Ore electrolysis > High temperature molten oxide electrolysis (>1500°C) |
Molten oxide electrolysis (MOE) is used to produce liquid metal directly from oxide feedstocks. Electrons are the reducing agents, and the products of the reaction are pure metal and oxygen. The steelmaking process requires temperatures of up to 2 000°C. |
4 |
Moderate |
|
Ore electrolysis > Low temperature alkaline electrolysis (110°C) |
The electrolytic steelmaking process, supplied by renewable energy, transforms iron oxides into steel plate at a low temperature in alkaline solution, with significant reduction of energy use. |
4 |
Moderate |
|
Reducing metal forming losses and lightweighting >Additive manufacturing |
Reducing yield losses in manufacturing (e.g. sheet metal in the automotive industry) would reduce material demand and in turn emissions from material production. Additive manufacturing, a digitalised production process in which three-dimensional objects are produced by successively adding material by layer, leads to minimal material losses compared with processes that cut objects from larger pieces of material. It also facilitates design of lighter parts. |
7 |
Moderate |
|
Smelting reduction > CCUS |
A new oxygen-rich smelting reduction technology for producing steel is being developed, consisting of a reactor in which iron ore is injected at the top and powder coal at the bottom. The powder coal reacts with the molten ore to produce liquid iron that is the base material to produce high quality steel. The use of pure oxygen makes the process well suited to integrate CCUS as it generates a high concentration of CO2 offgas and emissions are delivered in a single stack (a standard steel mill plant has several emission points). CCUS could also be applied to existing smelting reduction technologies. The offgases of these processes still contain considerable energy content along with CO2, however, so CCUS would also probably be needed on a power plant using these offgases to realise near-zero emission levels. |
7 |
Very high |
|
Smelting reduction > Smelting reduction based on hydrogen plasma |
The smelting reduction based on hydrogen plasma is the process of using hydrogen in a plasma state to reduce iron oxides, through the generation of a hydrogen plasma arc between a hollow graphite electrode and liquid iron oxide. |
4 |
Moderate |
* Technology readiness level (TRL) is based on a scale of 1 to 11, with 1 representing the lowest level where only basic principles have been identified and 11 representing the highest where proof of stability has been shown. Note: CCUS = carbon capture, utilisation and storage. Source: ETP Clean Energy Technology Guide, https://www.iea.org/articles/etp-clean-energy-technology-guide.
Cement sub-sector
Among heavy industries, the cement sub-sector also accounts for a large share of energy consumption and of CO2 emissions. Global cement demand, which had remained flat over a couple of years before the Covid‑19 crisis, is expected to shrink by 4% in 2020. In the long term, however, the production of cement is projected to continue rising as populations grow and infrastructure needs increase, especially in emerging economies. Without effective measures to improve energy efficiency, curb global cement demand and create markets for innovative technologies, CO2 emissions from cement production will continue to rise.
The global benchmarking project shows that the cement sub-sector, like iron and steel, has significant potential to improve efficiency. The potential can be seen by looking at the specific thermal energy consumption to generate the high temperatures needed to produce clinker, the key ingredient in cement, which is typically made of a mixture of limestone and clay. The G20 average of specific thermal energy consumption is well above the energy consumption possible using the best available technology. In 2018, only India came close to achieving the thermal specific consumption possible with best available technology across its cement sector.
Replacing fossil fuels with alternative fuels is a key path to decarbonise the cement sector, taken notably by Germany, the United Kingdom and the European Union as a whole. Alternative fuels include biogenic and non-biogenic wastes and biomass. A cautious approach is needed when using non-biogenic wastes, which can be CO2 intensive.
Thermal specific energy consumption per tonne of clinker in selected countries and regions, 2018
OpenComparing specific consumption of electricity in the cement sector with electricity use possible with the best available technology shows that almost all countries have potential to use less electricity per tonne of cement produced.
Electricity use per tonne of cement in selected countries and regions, 2018
OpenAs with the iron and steel sub-sector, the global benchmarking project identifies untapped opportunities for efficiency gains in the cement sub-sector in many G20 countries. The energy efficiency of clinker and cement production facilities is largely determined by the original engineering design. Dry kilns with a precalciner and a staged cyclone preheater – which heat the raw materials before they reach the kiln – are the most efficient kilns commercially available today and are deployed extensively across the world. To achieve maximum potential efficiency, however, adequate machinery maintenance and operation are essential, as well as process automation. Strategies to improve specific consumption of electricity include switching to more efficient grinding technologies, such as from ball mills to high-pressure grinding rolls and vertical roller mills, as well as using excess heat recovered from the kiln for power generation.
In addition, the energy intensity of cement production can be lowered by substituting clinker with other materials (e.g. blast furnace slag, fly ash from coal plants, calcinated clay) to create blended cement mixes and hence reduce the clinker-to-cement ratio. In 2019, clinker made up about 72% of cement on average worldwide. The potential to replace is highly dependent on local availability of clinker substitutes, as well as on the required properties of the final concrete product, which are determined by local standards and end-use applications.
Additional technological improvements include readily available efficient technologies and a range of innovative low- or nearly-zero carbon technologies that require further research and development.
Technology opportunities to achieve net-zero emissions in the iron and steel sector
|
Technology |
Details |
Readiness level (TRL)* |
Importance for net-zero emissions |
|---|---|---|---|
|
Grinding > Advanced grinding technologies |
A range of more efficient raw material and fuel grinding technologies for cement production are under research and development. They include contact-free grinding systems, ultrasonic comminution, high-voltage power pulse gragementation, low temperature comminution. |
6 to 9 |
Moderate |
|
Raw materials > Alternative cement constituents > Calcined clay |
Calcined clay can be used instead of clinker in blended cements. |
9 |
High |
|
Raw materials > Alternative binding material > Alkali‑activated binders (geopolymers) |
Alkali-activated binders are produced by the reaction of an alumino-silicate (the precursor) with an alkali activator. They rely on materials similar to those used in blended cement to reduce the clinker-to-cement ratio. |
9 |
Moderate |
|
Unhydrated cement recycling |
In the process of concrete curing, some portion of cement does not come in contact with water and is left unhydrated (some estimates suggest that up to 50% of cement could remain unhydrated). New concrete crushing technologies are under development that would enable recovering this unhydrated cement from end-of-life concrete for direct reuse as new cement. |
9 |
Moderate |
|
Curing > CO2 sequestration in inert carbonate materials (mineralisation) |
CO2 from industrial emitters can be used as a raw material in the production of building materials. The most mature applications involve replacing water with CO2 during the formation of concrete, called CO2 curing, and the reaction of CO2 with waste materials from power plants or industrial processes (e.g. iron slag, coal fly ash), which would otherwise be stockpiled or stored in landfill, to form construction aggregates (small particulates used in building materials). The CO2 used in building materials is permanently stored in the product. CO2-cured concrete can cost less than conventional concrete, while producing building materials from waste and CO2 can be competitive in some cases as it avoids the cost of conventional waste disposal. Producing building materials from waste can be energy-intensive, in particular the pre-treatment and post-treatment steps. For structural applications of building materials, such as buildings and bridges, multi-year trials are required to demonstrate safe and environmentally friendly performance. |
9 |
Moderate |
|
Cement kiln > CCUS > Chemical absorption, partial capture rates (less than 20%) |
Chemical absorption of CO2 is a common process operation based on the reaction between CO2 and a chemical solvent (e.g. amine-based). The CO2 is released at temperatures of 120°C to 150°C and the solvent regenerated for further operation. It can be applied to kilns, the main unit producing clinker for cement production |
8 |
Moderate |
|
Cement kiln > CCUS > Chemical absorption (full capture rates) |
See above. |
7 |
Very high |
|
Raw materials > Alternative binding material > Carbonation of calcium silicates |
Cements based on carbonation of calcium silicates can sequester CO2 as they cure. Therefore, even if they are based on similar raw materials to Portland cement clinker, these types of cement can yield zero process CO2 emissions in net terms, as the emissions would essentially be re-absorbed during the curing process. |
8 |
Moderate |
|
Cement kiln > CCUS > Calcium looping |
Calcium looping involves CO2 capture at high temperature using two main reactors. In the first reactor, lime (CaO) is used as a sorbent to capture CO2 from a gas stream to form calcium carbonate (CaCO3). The CaCO3 is transported to the second reactor where it is regenerated, resulting in lime and a pure stream of CO2. The lime is then looped back to the first reactor. Nearly pure oxygen is typically used (oxyfuel combustion) to supply a large heat flow to the second reactor. A main potential benefit of calcium looping is lower overall process energy consumption than in other capture technologies. The technology is well suited for application to the flue gases from kilns, the main unit producing clinker for cement production. |
7 |
Very high |
* Technology readiness level (TRL) is based on a scale of 1 to 11, with 1 representing the lowest level where only basic principles have been identified and 11 representing the highest where proof of stability has been shown. Note: CCUS = carbon capture, utilisation and storage. Source: ETP Clean Energy Technology Guide, https://www.iea.org/articles/etp-clean-energy-technology-guide.
Improving the availability, scope and quality of country-level data on energy consumption in industrial sectors would further enhance the value of global energy efficiency benchmarking analysis as an effective tool for policy makers. As illustrated in the analysis of the iron and steel sub-sector, detailed and mutually comparable data of each process would make it possible to produce a solid cross-country comparison. International co‑operation will be key to improving the collection and progressive harmonisation of data across countries. The IEA will continue to work with countries to improve data collection, quality and analysis.
Strong regulations, incentives and information can lead to rapid gains and higher levels of efficiency
Policy action is necessary to exploit the full energy efficiency potential identified through global benchmarking. Governments can use a range of policy measures to scale up efficiency investments in key technologies and business solutions in the industry sector, including regulations, incentives and information. In combination, these measures can boost energy efficiency across the market when they promote installation of energy-efficient equipment, optimisation of production processes through better controls and maintenance, and retrofitting with more energy-efficient and less carbon-intensive technologies.
Regulations are a mainstay of such policy packages, laying out legal requirements and pushing industries to be more efficient in their operations and outputs. Regulations on key industrial equipment (e.g. motors, pumps, fans and heating and cooling equipment), such as minimum energy performance standards, are among the best cross-cutting approaches that raise efficiency across key industrial sub-sectors. Minimum energy performance standards have been implemented at the national level, such as the US Energy Star Program and Japan’s Top Runner Program, and at a broader regional level, such as the EU Ecodesign regulation and the Pacific Appliances Labels and Standards (PALS).
Utility-funded programmes, such as energy efficiency obligations found in North America and Europe, are another cross-cutting approach. They unlock efficiency’s benefits by placing binding energy saving targets on energy utilities, often combined with tradable certificates, and requiring them to work closely with energy users to improve efficiency. In Canada and the United States, combined spending on utility-funded energy efficiency and demand response programmes totalled almost USD 9 billion in 2017. As of 2020, there are 49 utility-funded energy efficiency programmes in 24 countries
Requiring businesses to meet specific improvement targets is another way of creating a regulatory push on energy-consuming industries. Designated energy users are required to bring the efficiency of their industrial operations up to the target levels. Failure to meet the target can lead to fines. Some countries have established energy efficiency trading schemes that provide incentives for businesses to go beyond allocated targets by monetising the additional savings in the form of tradable certificates. For example, China’s Top 10 000 Programme sets energy savings targets for more than 10 000 large energy-intensive companies and closely follows their progress through regular quarterly monitoring by local authorities via energy audits and energy management systems. China’s Strategic Action Plan for Energy Development (2014‑2020) restricts the expansion of highly energy-consuming production facilities while speeding up the elimination of inefficient production capacity and the implementation of key energy savings projects.
Another example comes from India where the Perform, Achieve and Trade scheme sets sector- and company-specific targets for specific energy consumption in energy‑intensive industries. The scope of PAT is being expanded to cover multiple sectors, including commercial buildings (hotels) and efforts are being made to improve energy efficiency in small and medium-sized enterprises. PAT is associated with a market-based mechanism to encourage the cost-effective reduction of energy consumption. Industries that surpass their goals are offered incentives in form of energy saving certificates that they can trade with lower-performing industries through a market-based mechanism.
Information is an important pillar of the policy package. Managers and operators cannot make informed decisions about energy efficiency without access to relevant, timely data and other information. Several information tools are readily available that support the implementation of energy audits and energy management systems. Information campaigns and training workshops are particularly effective for small and medium-sized enterprises, where investment decisions depend on one or just a few individuals who may not be aware of efficiency benefits and opportunities.
Comprehensive data sets enable managers to identify untapped opportunities in each process route or even at each production step by comparing the efficiency of their operations with global averages or the efficiency obtainable using the best available technologies. Such detailed data can help policy makers and industries benchmark their levels of efficiency, providing a sound basis for setting ambitious, achievable efficiency targets. In Germany, information on energy efficiency is made available via a range of platforms, including the Energy Efficiency Networks Initiative, which promotes the transfer of know-how between countries, and a public list of professional energy auditors that create trust in the market.
India organises a series of workshops and training programmes to support the designated companies in implementing the Perform, Achieve and Trade scheme. In the Indian state of Gujarat, qualified energy auditors implemented an information-based scheme called the Micro, small and medium-sized enterprises such as metal-processing, re-rolling, foundry and chemical industries could register for these audits, later claiming financial incentives to cover the fees of the auditor. Auditors would conduct simple visual investigative audits and table-top surveys of manufacturing facilities’ energy bills, and submit an audit report containing recommendations on how to save energy.
Financial incentives can remove barriers to investment in energy efficiency, trigger private capital and help businesses to make significant changes to technologies. In Germany, a leader in implementing certifications of ISO 50001 –international standard for energy management systems – industries’ voluntary commitments to implementing energy efficiency measures are strongly supported by governments through a range of financial schemes. These include lowering energy and electricity taxes, funding for key technologies, such as the use of waste heat and renewables for process heat, and funding for key industrial equipment. Industries also have several opportunities to finance the introduction of digital technologies for better monitoring and controls of their industrial processes, and to finance the use of green hydrogen and other low-carbon technologies.
Further examples come from Spain, Brazil and Poland. Spain’s Programme of Energy Efficiency Actions in small and medium sized enterprises and large companies encourages energy efficiency action and reduction of CO2 emissions. The programme offers financial support as well as the Industrial Competitiveness Incentive Programme, which backs industries’ investments in improving industrial facilities. Brazil has begun the third cycle of its Strategic Alliance Programme for Energy Efficiency, in which the government will fund up to 40% of the cost of energy efficiency consulting services for industrial plants. The programme will target measures to decrease electricity consumption. Poland has introduced Energy Plus, an incentive programme combining loans and grants for industry that will run from 2019 to 2025. The programme aims to reduce wastage of primary raw materials by improving production processes that minimise or utilise downstream waste and waste heat.
In the context of stimulus spending to counteract the economic effects of the Covid‑19 crisis, governments could consider increasing finance for efficiency measures by expanding pre-existing mechanisms and public funds for installing energy efficient, low-carbon technologies. Direct public financing, such as grants, is likely to be particularly important in many sectors in the short term, and could be designed both to maximise immediate activity and to leverage additional private investment.
Governments could also consider a range of innovative approaches that aim to get finance flowing to where it is needed. Measures that have proven effective in attracting private sector finance include technical and commercial derisking support, such as the credit guarantee programme for industries in China, and innovative finding schemes, such as on-bill financing linked to utility bills for commercial or industrial buildings in the United States. Energy services companies design, install and, in some cases, finance energy efficiency projects through a contractual agreement with the energy-using customer. Usually using an energy performance contract, the energy services company identifies and implements energy efficiency opportunities, the financial returns from which are subsequently shared with the customer.
Digitalisation offers opportunities for efficiency improvements
The age profile, investment cycles and the availability of recyclable materials all influence the actual efficiency levels of key industrial processes, and the combination of these regulations, incentives and information provision will help policy makers drive efficiency improvements to the BAT efficiency levels as identified through the global industry efficiency benchmarking analysis. The implementation of energy management systems will ensure that every opportunity for efficiency improvement is identified and implemented, optimising industrial operations and processes.
Beyond the key technological dimensions of efficiency improvements, efficiency opportunities will also come from digitalisation, which is opening up a new generation of efficiency thinking and increasing its value to energy systems. Digitalisation includes not only enhanced data collection but also analytics that produce actionable insights by drawing on computation of vast amounts of data, as well as greater connectivity that increases the exchange of data between machines and humans.
Digital technologies can increase energy efficiency by reducing energy used per unit of activity, or end-use efficiency. By increasing connectivity, they can also improve the efficiency of the entire energy system (system efficiency). And by increasing connectivity among end-use applications or even between applications and grid systems, digitalisation can take energy efficiency thinking one step further, with smart digital technologies reducing costs, overcoming investment barriers and enabling new business models.
Digital technologies create a range of opportunities to increase efficiency within industrial plants and beyond. Smart sensors enable better monitoring of more parameters in depth, ranging from operating conditions to equipment status. Such monitoring allows for more thorough diagnosis of systems, early detection of potential faults and optimisation of the whole industrial process. Manufacturing processes can also be optimised by using advanced energy management systems, in which traditional energy management systems are supported by digital technologies and advanced software applications.
For instance, advanced data analytics can enable the creation of digital twins that can be used to enhance simulation and optimisation of industrial design, resulting in more sophisticated control of industrial processes and equipment. In certain industries, such as construction, use of industrial robots and 3D printing is also becoming a common, improving optimisation of product design and manufacturing processes. Cloud-based solutions and similar collaborative online platforms open up opportunities for optimising product value chains beyond individual factories through active exchange of information and more efficient management of resources and materials.
Digital technologies also allow for a more modernised, rounded concept of energy efficiency that considers system optimisation. The greatest potential efficiencies lie in large industrial thermal loads and processes that are already providing demand-side flexibility for grids. In the United States, for example, the combined wholesale demand response capacity of all regional system operators grew to around 27 GW by 2020 (around 6% of peak demand), with an additional 5 GW offered through retail programmes. Load control, interruptibility services and reserves markets also expanded elsewhere in the country.
A few countries are already exploring new markets and business models through dedicated platforms and pilot projects that bring together industries and experts, such as industrial platforms and investment support for digitalisation of industry in Europe, a national manufacturing portal in the United States – Manufacturing USA – to feature new manufacturing initiatives, and the Smart Manufacturing Innovation Centre in Korea.
Policy interventions can unlock this potential when well designed and implemented as part of a wider effort to scale up end-use efficiency and system level efficiency. The IEA policy framework Readiness for Digital Energy Efficiency highlights a set of critical policy considerations for harnessing digital technologies for energy efficiency. The framework is designed to ensure that the benefits of digital energy efficiency are realised through policies that address a range of issues, from balancing data accessibility with data privacy to helping remove regulatory barriers to innovation.
Many countries have set or are actively considering net-zero emissions targets. Energy efficiency will play a central role in reaching these targets. While much of the discussion on decarbonisation has focused on the supply of energy, such as renewables, biofuels and hydrogen, it is equally important to consider early ways to cut demand for energy. Energy efficiency can accelerate energy transitions by locking in higher levels of efficiency across key industrial assets that will operate for decades to come and therefore significantly lower their energy intensity and carbon intensity. Efficiency improvements are a mainstay of long-term decarbonisation strategies, indicating a potential improvement in the global average energy intensity of industrial activity of 25% to 30%, particularly in the aluminium, paper and cement sub-sectors. While the focus of this report is on the improvements available through energy efficiency, material efficiency achieved by extending the lifetime of products (such as buildings); improving the design of goods and using alternative materials such as timber (to reduce demand for materials with a high energy and carbon intensity); and developing reuse and recycling chains can also play a major role in achieving decarbonisation ambitions.
Annex - G20 Industry energy efficiency benchmarking – notes on methodologies
Iron and steel
The primary production of crude steel has three key phases: raw material preparation, ironmaking and steelmaking. The most common primary production pathway is the blast furnace-basic oxygen furnace route, which accounts for around 70% of global steel production and around 90% of primary production. The other main method of primary steel production is the direct reduced iron-electric arc furnace route. The secondary production route mainly requires electricity to melt the steel (collected from scrap) in an electric furnace, often along with a small amount of natural gas or coal to form a protective slag foam. Highly conductive graphite electrodes are also consumed during the process of heating the scrap metal to temperatures of up to 1 800°C. Electric arc furnaces are the most commonly used furnace for scrap‑based production.
The main blast furnace-basic oxygen furnace and electric arc furnace routes (both direct reduced iron and scrap-based electric arc furnaces) together account for 95% of global steel production.
Main steel production pathways and material flows in 2019
Open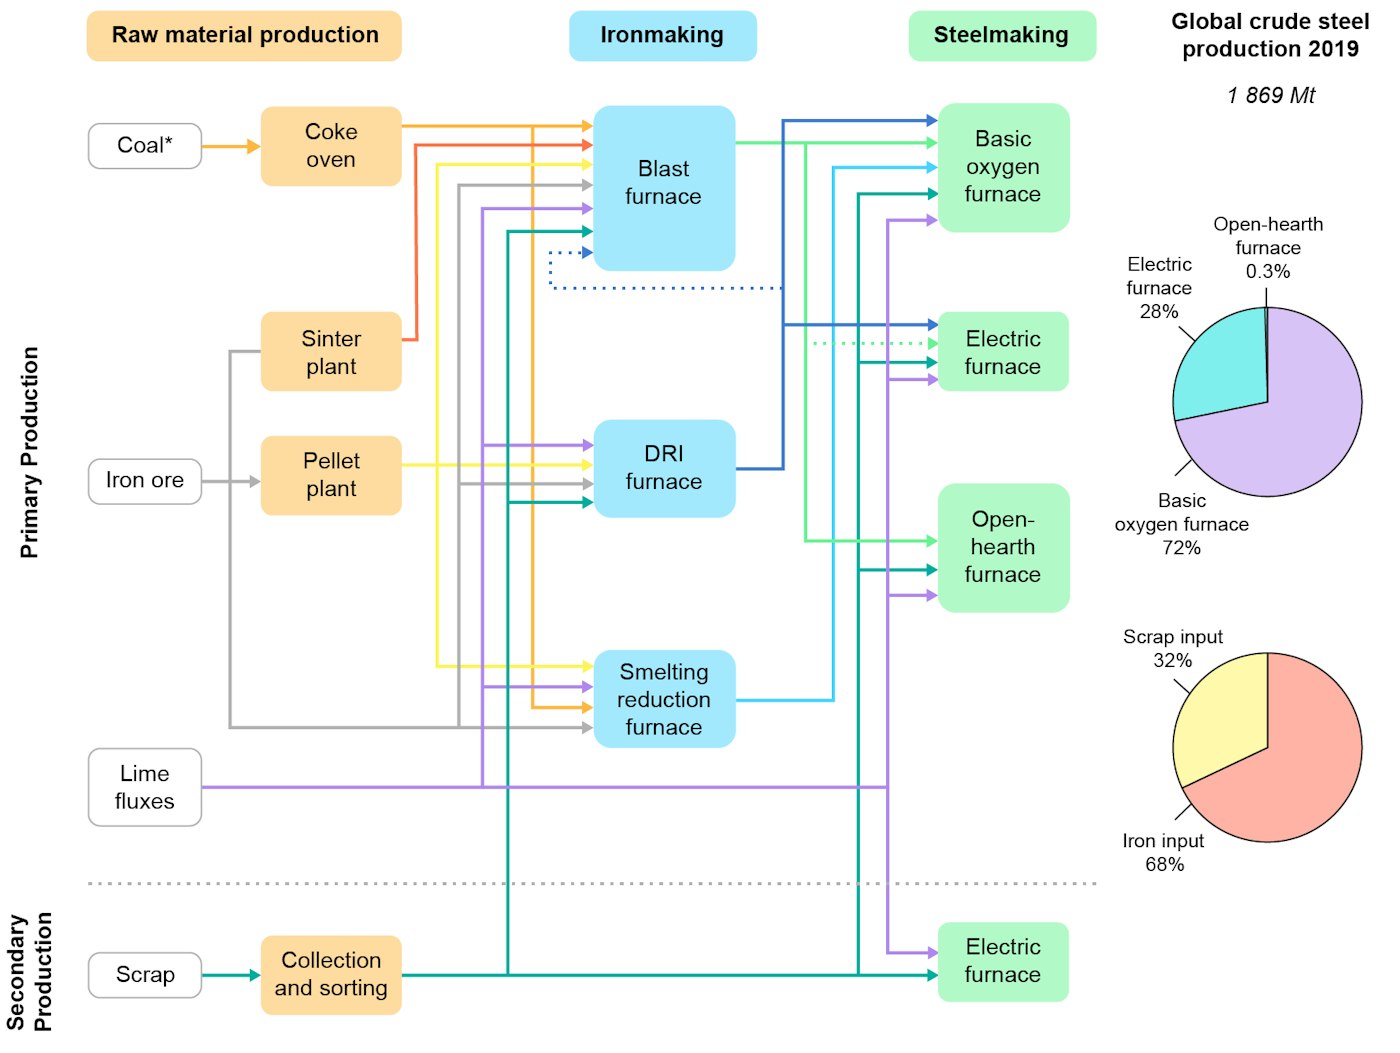
Methods and boundaries
Reported aggregated specific consumption is calculated by dividing the final energy demand related to iron and steel, blast furnaces and coke ovens as reported in the IEA Energy Balances by total production of crude steel as reported the Worldsteel Steel Statistical Yearbook 2020.
Final energy demand includes three categories from the IEA Energy Balances: iron and steel, blast furnaces and coke ovens. These categories are defined as follows (as per World Energy Balances 2019 Edition: Database documentation):
- Iron and steel: ISIC Rev. 4 Group 241 and Class 2431.
As defined by the UN International Standard Industrial Classification of All Economic Activities, Rev. 4 [Extracts]:
Group 241 = Manufacture of basic iron and steel:
“This class includes operations of conversion by reduction of iron ore in blast furnaces and oxygen converters or of ferrous waste and scrap in electric arc furnaces or by direct reduction of iron ore without fusion to obtain crude steel which is smelted and refined in a ladle furnace and then poured and solidified in a continuous caster in order to produce semi-finished flat or long products, which are used, after reheating, in rolling, drawing and extruding operations to manufacture finished products such as plate, sheet, strip, bars, rods, wire, tubes, pipes and hollow profiles.”
Group 2431 = Casting of iron and steel
“This class includes the casting of iron and steel, i.e. the activities of iron and steel foundries.” (The full list of specific activities covered can be found in the ISIC guide referenced above.)
- Blast furnaces: Includes the production of recovered gases (e.g. blast furnace gas and oxygen steel furnace gas). The production of pig iron from iron ore in blast furnaces uses fuels for supporting the blast furnace charge and providing heat and carbon for the reduction of the iron ore. Accounting for the calorific content of the fuels entering the process is a complex matter as transformation (into blast furnace gas) and consumption (heat of combustion) occur simultaneously. Some carbon is also retained in the pig iron; almost all of this reappears later in the oxygen steel furnace gas (or converter gas) when the pig iron is converted to steel. The IEA assumes that the carbon input into the blast furnaces equals the carbon output. This is roughly equivalent to assuming an energy transformation efficiency of 40%.
- Coke ovens: Includes the manufacture of coke and coke oven gas. The aggregated energy specific consumption related to the implementation and adequate operation of best available technology is calculated for each country by applying the best available technology energy specific consumption for each process step within each process route to the share of production by process route in 2016 in that country. The best available technology energy intensities have been compiled by the IEA from a variety of sources and reviewed by industry experts. The aggregated energy specific consumption considers the country’s distribution of crude steel production by process routes (blast furnace-basic oxygen furnace, direct reduced iron-based and scrap-based electric arc furnace; the open hearth furnace share is divided between the basic oxygen furnace, direct reduced iron and electric arc furnace production categories given that it could likely be replaced).
- Best available technology: The aggregated energy intensity related to the implementation and adequate operation of best available technology is calculated for each country by applying the best available technology energy intensity for each process step within each process route to the share of production by process route in 2018 in that country. The best available technology energy intensities have been compiled by the IEA from a variety of sources and reviewed by industry experts and shown in the table below.
Energy Intensities by Route
|
Blast Furnace-Basic Oxygen Furnace Process Route (BF-BOF) |
(GJ/t) | |
|---|---|---|
|
Coke oven with coke dry quenching |
|
2.16 |
|
Sintering plant with WHR |
|
1.44 |
|
Pelletising plant |
|
0.39 |
|
Blast furnace |
coal injection (with Top-pressure Recovery Turbines) |
11.71 |
|
|
gas injection (with Top-pressure Recovery Turbines) |
10.49 |
|
|
charcoal |
23.67 |
|
Basic Oxygen Furnace with BOFG recovery and WHR |
|
-0.75 |
|
|
|
|
|
Direct Reduced Iron-Electric Arc Furnace (DRI-EAF) |
(GJ/t) | |
|
Pelletising plant |
|
0.39 |
|
DRI plant |
gas based |
10.89 |
|
|
coal based |
19.86 |
|
Electric Arc Furnace DRI based with WHR |
|
1.75 |
|
Scrap-based EAF |
(GJ/t) | |
|
Electric Arc Furnace scrap based with WHR |
|
1.13 |
The share of crude steel production by process route is calculated by applying the distribution of plant capacity data by technology in a given country to the production in the same country as a proxy. In the case of the direct reduced iron- electric arc furnace route, a material loss of 5% is assumed when converting sponge iron to liquid steel.
Data sources
The reference year of the most recently available data is 2018.
Data for aggregated energy specific consumption and steel production are taken from the following databases as follows:
Final energy demand from IEA World Energy Balances (2019).
Crude steel production from Worldsteel Steel Statistical Yearbook (2020).
Considerations when comparing countries and regions
The aggregated energy specific consumption of steel production is highly dependent on the process routes used, with primary routes (basic oxygen furnace, direct reduced iron andopen hearth furnace) consuming considerably more energy than secondary steel production through scrap-based electric arc furnaces. Crude steel production in an electric arc furnace using scrap is 60% to 70% less energy-intensive than primary production. Regional limitations of significant scrap availability at a competitive cost, as well as differences in the quality of raw materials and energy prices, are the main factors affecting the distribution of production routes’ shares by country. It is also possible that the calculated energy intensity could be lower than the actual intensity in countries where production of coke is mainly outsourced. Also, varied calculation conditions in each country in the energy conversion sector influence the energy consumption.
Data limitations
Data on energy consumption by process route are not currently publicly available. This data would enable direct regional comparison of the energy efficiency within each process route to identify areas for improvement at the process technology level.
It will also be important to collect data under unified conditions, such as conversion of electrical energy to primary energy and handling of energy for materials such as cokes.
Improved country reporting would be needed to provide more accurate data on energy specific consumption in this sector. In particular the questionnaire used by the IEA for establishing energy efficiency indicators would allow such analysis.
Cement
Cement manufacture is a three-stage process: raw material preparation, clinker production and clinker grinding with other components to produce cement. Different raw materials are mixed and milled into a homogeneous powder, from which clinker is produced in high-temperature kilns where direct emissions of CO2 occur. Clinker is then ground with gypsum to produce cement. Cement can be produced at the kiln site, or at separate grinding or blending plants. Blended cements or “combinations” can also be produced at the concrete plan.
Cement manufacturing
Open
Methods and boundaries
Both thermal energy specific consumption and electricity specific consumption are reported for the countries covered by the Cement Sustainability Initiative Getting the Numbers Right Emissions Report. Since not all countries are individually reported bythe Cement Sustainability Initiative, regional data are also shown. Waste as displayed in the graph (in alternative fuels) includes both biogenic and non-biogenic wastes.
The reported data from the Cement Sustainability Initiative adhere to the Cement Sustainability Initiative Cement CO2 and Energy Protocol.
Thermal energy specific consumption of clinker production includes fuels (excluding electricity) used for raw material preparation (grinding, homogenising, drying or slurrying) and pyroprocessing of raw material in cement kilns (pre-heating, calcination, clinkering, and cooling).
Thermal energy consumption for clinker production excludes drying of fuels and is reported as category 25aAG in the Cement Sustainability Initiative Getting the Numbers Right report. The proportion of each fuel category, reported as category 25aAGFC in the report, is applied to the total thermal energy consumption to arrive at energy consumption by fuel type.
Electricity consumption of cement production includes electricity used for raw material preparation, clinker pyroprocessing, and grinding and blending clinker with other mineral components to make cement.
Electricity use for cement production correspond to category 33AGW of the Getting the Numbers Right report.
- Best available technology: Best available technology energy specific consumption is based on information reported by experts in several studies, noted below. Best available technologies were only considered for total thermal energy consumption and total electricity consumption. For the thermal portion, this approach was chosen as the different actions (preheaters and precalciners for instance) can be considered as part of the same system and not separate process units. For the electricity portion, the approach followed has been to consider an average intensity for the different units (raw material grinders, fuel grinders, cement grinders, the kiln) to estimate the gains in moving to best available technology electricity consumption for cement production overall.
Data sources
The reference year of most recently available data is 2018.
Energy specific consumption (thermal and electric):
Cement Sustainability Initiative, Getting the Numbers Right Emissions Report 2018.
Best available technology energy specific consumption:
European Cement Research Academy and Cement Sustainability Initiative (2017), Development of State of the Art Techniques in Cement Manufacturing: Trying to Look Ahead.
World Business Council for Sustainable Development (2018), Low carbon technology roadmap for the Indian cement sector: Status review 2018.
Lawrence Berkeley National Laboratory (2008), World best practice energy intensity values for selected industrial sectors.
Considerations when comparing countries and regions
Regional factors such as moisture content and burnability of raw materials, typical clinker composition and average capacity of cement plants affect the thermal specific consumption of clinker; additionally, thermal energy specific consumption typically increases with use alternative fuels, and clinker substitutes (such as blast furnace slag and calcined clay).
Regional factors such as product fineness requirements and the hardness of raw materials and fuels affect the electricity specific consumption of cement.
Due to the variability of these local factors, the energy intensities shown for aggregated regions may not accurately represent that the energy intensities of each individual countries.
Data limitations
Data on thermal and electricity intensities are not available for all individual countries.
Additionally, the Getting the Numbers Right report covers only a proportion of cement producers in each country or region, as follows:
|
Region |
Coverage in 2018 |
|---|---|
|
Brazil |
100% |
|
Canada |
99% |
|
France |
100% |
|
Germany |
98% |
|
India |
100% |
|
Italy |
83% |
|
United Kingdom |
100% |
|
United States |
80% |
|
World |
21% |
As for iron and steel, improved country reporting would be needed to provide more accurate data on energy specific consumption in this sector. In particular the questionnaire used by the IEA for establishing energy efficiency indicators would allow such analysis.